Close
0%
0%

SerialPlot - Realtime Plotting Software

Small and simple software for plotting data from serial port

Similar projects worth following
This is a Qt based software for plotting data from serial port in real time.

IMPORTANT: instead of commenting please consider creating a ticket at issue tracker (https://todo.sr.ht/~hyozd/serialplot or https://github.com/hyOzd/serialplot/issues) Hackaday's notification system is broken and I may not notice your messages.

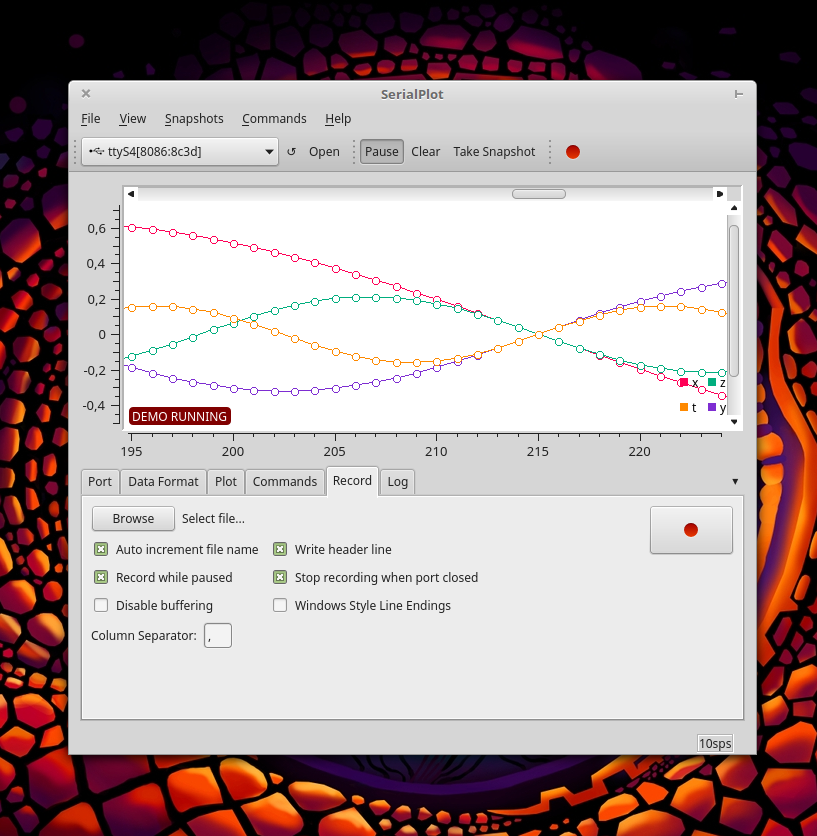
SerialPlot accepts 3 different types of data input:

  • simple binary stream, supports different number formats (unsigned/signed - 8/16/32 bits and float)
  • ASCII data in CSV format
  • user defined custom frame format (frame start byte, frame size, checksum etc..)

You can take snapshots of current view and store them in CSV files. You can also load them back from csv files, for convenient viewing.User can also define "commands" to be sent to the serial port device with a click. Commands can be defined in HEX or ASCII format.

In the sidebar you can find links to Linux and Windows downloads and source code.

  • Moving Project to Git/Github (?)

    Hasan Yavuz Özderya05/31/2021 at 20:11 1 comment

    I'm considering moving this project to git. There has been a few requests. Not many. But I feel like reason is that people just don't request such things unless a project is really really popular. Actually there has been a git repository at github for quite some time. But I did not update it. I only kept it for visibility and as another place for people to create tickets.

    From now on; I will keep github repository up to date which is at: https://github.com/hyOzd/serialplot

    I enjoy using mercurial even though I don't have much opportunity to do so. For a while I will keep using both git and mercurial. There is a mercurial extension called hggit that makes this relatively easy and pain free. For git users there should be no drawbacks.

    To be honest if git repository turns into something popular I will probably stop using mercurial altogether.

  • SerialPlot v0.12 release

    Hasan Yavuz Özderya05/14/2021 at 16:19 3 comments

    This is another minor release. There isn't any significant changes.

    Changes:

    • Filter by prefix for ASCII data format parser (thanks to Alexander Amelkin)
      This is useful when your data is mixed with other information such as log messages. There is no way of displaying such log messages on SerialPlot yet.
    • Export SVG (thanks to martijuerg)
    • Other minor fixes improvements etc:
      • remember user entered custom baud rate
      • add double precision floating point number format support for binary readers
      • fix 'settings invalid' error when loading config with 'first byte is size byte' enabled
      • fix for data format selection can be empty (no button is selected state which is invalid)

    As always you can find latest download links in the sidebar.

    Download links for v0.12:

    Windows installer: https://serialplot.ozderya.net/downloads/serialplot-0.12.0-win32-setup.exe

    Windows EXE 7Zip: https://serialplot.ozderya.net/downloads/serialplot-0.12.0-win32.7z

    Windows EXE: https://serialplot.ozderya.net/downloads/serialplot-0.12.0-win32.exe

    Linux AppImage (based on Ubuntu 18.04): https://serialplot.ozderya.net/downloads/serialplot-0.12.0-x86_64.AppImage

  • SerialPlot v0.11 release

    Hasan Yavuz Özderya09/14/2020 at 11:12 1 comment

    Well, it's been a while.

    But I decided to finally put together a new release. There aren't any big news or changes. To be honest what pushed me to finally create a new release is that I forgot to move the "downloads' section from the bitbucket before they axed the mercurial repositories and as a result got a lot of mails/comments from people around to world. Sorry.

    Here are some changes that come in v0.11:

    • command line options thanks to Mehmet Aslan
    • "value tracker" that displays the sample values under cursor
    • "Text View" panel to display read values
    • Gain and Offset to adjust input data
    • An experimental "Bar Plot" widget
    • added icons for Windows
    • recorder timestamp format
    • decimal precision setting for recorder
    • port read statistics
    • many fixes

    Download links:

    Linux AppImage (Ubuntu Trusty based, should work on anything newer):

    https://serialplot.ozderya.net/downloads/serialplot-v0.11.0-x86_64.AppImage

    Windows 32 bit (should work fine on 64 bit windows):

    https://serialplot.ozderya.net/downloads/serialplot-0.11.0-win32.exe

    Important: I didn't have time to test either of these images. Please let me know if you have any problems with them.

  • Building SerialPlot for Windows using Docker

    Hasan Yavuz Özderya09/14/2020 at 11:02 0 comments

    Building serialplot on windows isn't much different than building on linux. But it isn't as straightforward. Installing dependencies can be difficult. And it is also difficult to build a static EXE that doesn't require DLLs to keep it company. But most importantly it is difficult for me, because I don't use windows other than for gaming purposes. Unfortunately most users of SerialPlot use windows and as a result I can't ignore it.

    Luckily there is MXE to my rescue. This is a cross compilation toolchain to build windows binaries (and more) on a linux (unix like) host. Whats more is that they also provide 'static' toolchains. When you build your project with a static toolchain it is easier to deploy and can be smaller in size.

    So I prepared a dockerfile to make it even easier to build windows using docker. You can build this docker image on linux. AFAIK there are ways to run docker on windows host but I won't go into any details of that. It is also possible to use MXE in msys2, which is a layer to run unix programs on windows. In fact most of the windows releases until now has been built on windows using msys2 and mxe.

    Dockerfile is already included in the serialplot source code called:

    Dockerfile_mxe

    Assuming you have already installed docker, download the serialplot source code using mercurial and build the docker image:

    hg clone https://hg.sr.ht/~hyozd/serialplot/
    cd serialplot
    sudo docker build -t serialplot_mxe -f Dockerfile_mxe ./

    Remember this might easily take a couple hours depending on your internet speed and cpu power. To give you an idea resulting docker image is around 5GB in size.

    If all goes well you can get the built binary from inside the docker image with this command:

    sudo docker run --rm --entrypoint cat serialplot_mxe /serialplot/build_docker_mxe/serialplot.exe > ../serialplot.exe 


  • How to build SerialPlot on Linux

    Hasan Yavuz Özderya09/07/2020 at 07:59 0 comments

    These are the steps for building SerialPlot on linux. I will also provide more detailed steps for Ubuntu and similar debian based distributions.

    Building SerialPlot on linux is quite easy. Most difficult part (not really difficult) is gathering the dependencies. It is possible that you already have some of them installed such as a C++ compiler.

    I've also described how to build with docker which might be the easiest method if you are familiar with it.

    Install Dependencies

    You should have following dependencies installed, preferably using your package manager:

    • Qt5 Development Package (at least version 5.9; recommended 5.15)
    • Qt5 serialport and svg package
    • Cmake (version 3.x)
    • C++ compiler (somewhat new, should support C++11) and make (usually installed with a base package)
    • Mercurial (to download source code, optional)

    On ubuntu or similar operating systems you can install these dependencies with the  following command.

    sudo apt install build-essential qtbase5-dev libqt5serialport5-dev libqt5svg5-dev cmake mercurial

     Note: instead of 'qtbase5-dev' you can install 'qt5-default' package to make sure it is the default qt version.

    Also note: SerialPlot doesn't build with Qt4, you need Qt5.

    Also also note: you need internet access during build process. It is not necessary, but if you don't, you have to also have "Qwt" library installed.

    Get Source Code

    You can download the source code using mercurial with the following command. Mercurial is a version control tool very similar to git.

    hg clone https://hg.sr.ht/~hyozd/serialplot

    Or if you don't want to deal with the mercurial you can download the latest code from this link.

    https://hg.sr.ht/~hyozd/serialplot/archive/tip.tar.gz

    Build

    When you have everything ready, run following commands in the serialplot directory.

    mkdir build
    cmake ..
    make run

     This should build SerialPlot and start it.

    Building AppImage

    When you build SerialPlot this way it probably only works on your computer. It should work on other computers with the same distribution as yours as long as they have the correct libraries installed. If you want to lend your build to your friends you can create a portable executable called AppImage. This should run on most distributions. And it is how I release the Gnu/Linux version of the SerialPlot.

    It is easy to build SerialPlot appimage.

    Run below command in your build directory.

    cmake ..
    make appimage

    That's it. If everything goes well you should  now have SerialPlot appimage in your build directory, and it should run in most distributions (fingers crossed).

    Building with Docker

    There is a Dockerfile inside the serialplot directory ready to go. It is based on Ubuntu 18.04 (bionic) [used to be 14.04 (trusty)]. Building it, produces an appimage that you can use on Ubuntu/Debian based systems. Maybe on other distros too?

    If you don't have it installed, you can install docker on Ubuntu with this command:

    sudo apt install docker.io

    After that, get into the directory of 'serialplot' where the 'Dockerfile' exists and run this command. It might take some time depending on your internet speed.

    sudo docker build -t serialplot_bionic .

     This will build a docker image that should contain the SerialPlot appimage. After building appimage, you should get it from inside the docker image with this command.

    sudo docker run --rm --entrypoint cat serialplot_bionic /serialplot/build_docker/SerialPlot-x86_64.AppImage > ./serialplot.appimage

    Make it executable and start serialplot:

    chmod +x ./serialplot.appimage
    ./serialplot.appimage

    Notes

    Although actual build process is quite simple and straightforward, if you are not experienced you may have issues building SerialPlot successfully. It usually is missing dependencies. It rarely is an incompatible library. In that case please leave a comment : ) I will be happy to help.

    Also if you have steps for other distributions and recommendations, please share, I will...

    Read more »

  • Moving SerialPlot out of bitbucket

    Hasan Yavuz Özderya05/01/2020 at 10:15 4 comments

    Bitbucket is removing mercurial support along with all mercurial repositories.

    I decided to move the source code to sourcehut.

    Here is the mercurial repository: https://hg.sr.ht/~hyozd/serialplot/

    Here is the new issue tracker: https://todo.sr.ht/~hyozd/serialplot

    I haven't moved download files yet. I will probably have to host them myself. Sourcehut doesn't provide file hosting.

  • Sample value tracker development in progress

    Hasan Yavuz Özderya09/27/2018 at 21:11 2 comments

  • SerialPlot v0.10.0 Released

    Hasan Yavuz Özderya09/03/2017 at 15:19 0 comments

    SerialPlot 0.10 is released. This release brings some performance improvements, minor features and bug fixes.

    Instead of "number of samples" option in the "Plot" tab, now there are 2 options you can set. "Buffer Size" and "Plot Width". "Buffer Size" is the total number of samples that are kept in memory, while "Plot Width" is the maximum number of samples that are plotted at once, in X axis. To see previous samples you simply use the X axis scrollbar. The main reason for this distinction is the performance. Previously you couldn't set number of samples too high because SerialPlot tried to plot all data at one time. Now you can set "Buffer Size" to 1.000.000 and it will most likely will be fine as long as you keep "Plot Width" small. Another advantage is that, sometimes when you have frequently changing data, zooming way out doesn't mean much, you have too keep a certain zoom level in X axis to be able to see any detail. If you enjoy the old behaviour you can always set buffer size option same number as plot width and it should be fine. Remember though "plot width" option has a smaller limit then "buffer size" for performance reasons. A note; performance improvements are not done. I'm still working on some improvements to increase "buffer size" limitations.

    Now you can set RS232 control signals (DTR, RTS) and see input signal () statuses from the "Port" tab. Being able to set DTR signal was a requested feature so that SerialPlot can work with Arduino Leanardo board.

    Also we now have an update checker. You can launch it from the "Help" menu. It will check updates once a day when you first launch SerialPlot unless you disable it.

    Other improvements and bug fixes:

    • custom ASCII (csv) data column delimiter
    • fixed snapshot display bug
    • fixed command type not loaded/remembered
    • fixed duplicated channel names

    Check the sidebar for download links. I will try update the win32 version and launchpad PPA later this week.

  • Patch Release 0.9.1

    Hasan Yavuz Özderya05/05/2017 at 12:25 6 comments

    This patch fixes various issues and adds small improvements:

    • fix symbols getting stuck after multiplot mode
    • fix symbols in snapshot view
    • add options to disable (or always enable) symbols
    • panning (Ctrl+Left Mouse) @Maxim
    • show snapshot view in current plot settings
    • fix snapshot view axis stuck at [0-1]

    See downloads links at the sidebar.

  • SerialPlot 0.9 Released (Recording and Scrollbars)

    Hasan Yavuz Özderya04/17/2017 at 12:55 3 comments

    Hi everyone, it's release time. First of all I want to thank everyone who contacted me via various channels for their kind comments! And ideas of course... some to be implemented... some day... : )

    Changes:

    • scrollbars for plot (appears when zoomed)
    • continuous recording to CSV file
    • channels can be hidden and plot colors are adjustable ("Plot" tab)
    • bunch of various GUI improvements and minor bug fixes

    Installation for linux:

    PPA for Ubuntu 16.04 (xenial) and based distros: https://launchpad.net/~hyozd/+archive/ubuntu/serialplot

    Appimage(*) for other distros: https://bitbucket.org/hyOzd/serialplot/downloads/SerialPlot-x86_64.AppImage

    Installation for windows:

    64bit setup: https://bitbucket.org/hyOzd/serialplot/downloads/serialplot-0.9.0-win64.exe

    32bit setup: https://bitbucket.org/hyOzd/serialplot/downloads/serialplot-0.9.0-win32.exe

    (*) Appimage may be broken on some systems. Please let me know if you have any problems.

View all 18 project logs

Enjoy this project?

Share

Discussions

cha.chakry wrote 06/14/2018 at 11:27 point

I cannot complite project with qmake /mingw - there are link problems . have anyone tried in qtcreator/mingw/qmake combination ? please helpme out

  Are you sure? yes | no

Hasan Yavuz Özderya wrote 06/23/2018 at 19:28 point

Sorry, qmake project file (serialplot.pro) isn't up to date. You could use cmake which also gathers all dependencies (except Qt SDK). Building on windows is a pain. I actually use msys2 when I have to build release images. It all works like it does in linux. But installing msys2 and making it work can be difficult and time consuming to be honest.

  Are you sure? yes | no

Daniele Ziglioli wrote 09/27/2018 at 13:31 point

I also tried to  build a win32 version using msys2, but I'm not able to pass QCW-build:

-- Build files have been written to: /home/d.ziglioli/serialplot/build/qcw/src/QCW-build
[  6%] Performing build step for 'QCW'
[  1%] Generating ui_color_palette_widget.h
[  3%] Generating qrc_color_widgets.cpp
[  5%] Generating include/moc_color_palette_model.cpp
moc: /home/d.ziglioli/serialplot/build/qcw/src/QCW/include/color_palette_model.hpp: No such file
make[5]: *** [CMakeFiles/ColorWidgets-qt5.dir/build.make:67: include/moc_color_palette_model.cpp] Error 1
make[4]: *** [CMakeFiles/Makefile2:72: CMakeFiles/ColorWidgets-qt5.dir/all] Error 2
make[3]: *** [Makefile:84: all] Error 2
make[2]: *** [CMakeFiles/QCW.dir/build.make:112: qcw/src/QCW-stamp/QCW-build] Error 2
make[1]: *** [CMakeFiles/Makefile2:73: CMakeFiles/QCW.dir/all] Error 2
make: *** [Makefile:152: all] Error 2

are you able tu build it ? could you eventually release an updated win32 version ?

thanks.

PS: 

anyway thanks for the tool

  Are you sure? yes | no

Hasan Yavuz Özderya wrote 09/27/2018 at 18:12 point

@Daniele Ziglioli  which version are you trying to build? Did you get it from the bitbucket repository? qt color widget library recently moved their repository, if you have an older version of the source code that might be the problem.

  Are you sure? yes | no

Daniele Ziglioli wrote 09/28/2018 at 08:00 point

>@Daniele Ziglioli  which version are you trying to build? Did you get it from the bitbucket repository? qt >color widget library recently moved their repository, if you have an older version of the source code that >might be the problem.

Yes I've follow your instruction for mercurial download from bitbucket.

For the QT i've follow this: https://wiki.qt.io/MSYS2

  Are you sure? yes | no

Marcelo Pino wrote 03/01/2018 at 17:08 point

Hi there. First of all, thank you very much, Serial Plot is a very useful tool for me. I have some wishes for the application.
1) It could be helpful to see in real time (as log tab does) the list or table generated for Recording (The same text).
2) An option for adding system Date and/or system Time at the begining of each line in Record file.
3) In the Plot tab, a simple linear math opperation will help with calibrations, y=mx+b where Y is the output (plotted and recorded) data, x is the input data, and m and b constants configured in the channel list.

Well, may be I'm asking too much. But if it can be added would be great!
Anyway, congratulations for this nice project, and thanks again.

  Are you sure? yes | no

Hasan Yavuz Özderya wrote 03/12/2018 at 09:15 point

@Marcelo Pino Thanks for your comment. All 3 items are planned. #2 and #3 is going to take some time though. :)

  Are you sure? yes | no

Marcelo Pino wrote 03/12/2018 at 10:56 point

Great! I look forward to see it! I can test it if you want. Regards.

  Are you sure? yes | no

Jamie wrote 02/28/2018 at 16:06 point

Hullo everybody,

Could I make a suggestion to add detail to the install instructions to help out idiots like me?

If the instructions said if you distro has ... set BUILD_QWT to false "in the CMakelists file it would help a lot :)

This may sound silly or obvious but it's not! (if you aren't familiar with the config files for Cmake :) )

Good news it is quick to build on Raspberry Pi 3 under stretch and Ubuntu Mate for RPI once libqwt-qt5-dev is installed along with other dependencies.

Excited to try it out now!

Jamie

  Are you sure? yes | no

Hasan Yavuz Özderya wrote 03/12/2018 at 09:13 point

Jamie thanks for your comment. BUILD_QWT option is already mentioned in the README. Were you looking at the instructions here: https://bitbucket.org/hyOzd/serialplot ?

  Are you sure? yes | no

Jamie wrote 03/12/2018 at 10:45 point

Hi

Thanks for the reple

Yes I did follow the instructions at this link https://bitbucket.org/hyOzd/serialplot, I should have been more clear.

My suggestion was to change the instructions from

"set BUILD_QWT cmake option to false."

to

"set BUILD_QWT cmake option in the CMakelists file to false."

Not everyone knows which file to look for the change the flag, does that make sense? :)

P.s. the software is great.

Jamie

  Are you sure? yes | no

Hasan Yavuz Özderya wrote 03/12/2018 at 19:46 point

Well, you are right, I should write more detailed instructions. For the record you don't have to change the CMakeLists.txt file. Usual method is to set the options from the command line like this:

"cmake -DBUILD_QWT=false .."

Or you can start the cmake gui and do it from there:

"cmake-gui .."

  Are you sure? yes | no

Jamie wrote 03/12/2018 at 22:30 point

Haha, I did not know those options either, simpler than editing the text file!

I don't mean criticism, the instructions are good :)

Anyone with basic knowledge like me can complete them, just that one line explaining the usage of this option that may confuse people.

With VNC it makes a perfect remote data logger

All the best,

p.s. do you have a donation page somewhere?

Jamie

  Are you sure? yes | no

jarekgol wrote 03/31/2020 at 17:18 point

I also have problem with this part, but I grep'ed BUILD_QWT, find it in some cache file and in CMakelists. Changing in CMakelists and running cmake didn't help, in cache still was the same, so I deleted all in build, run again and it compiled.

ps. adding ppa shows some errors on Ubuntu 18.04 x64, so I compiled from sources.

Thanks for your program!

Jarek

  Are you sure? yes | no

Hasan Yavuz Özderya wrote 03/15/2018 at 08:10 point

Jamie, if you are on linux, you can use a utility called "socat" to redirect serial port over tcp, that way you don't have run serialplot on the remote device. Now thinking about it, it would be nice to add this to serialplot...

No I don't have a donation page. I couldn't find an alternative to paypal since its banned in my country.

  Are you sure? yes | no

Jamie wrote 03/15/2018 at 08:30 point

Morning,

Thanks for the suggestion, I have not used socat.

I should say the remote device is sitting in my desk, it is just a box with usb oscilloscope, diy meters and small LCD. It has WiFi so I use it.

That's a shame about American money company being banned. In Cuba they use the friends in Europe but it makes things less simple.

Jamie

  Are you sure? yes | no

Tobias wrote 02/23/2018 at 16:34 point

Hi! I love SerialPlot. Its the best free prog that i found. But i have a problem: In Version 0.9 i had wrong values printed on high data rate. I tried it with version 0.10 and then i only have chunks of serial values coming in. Also with arduino Serial Monitor and the 0.9 version. I uninstalled 0.10, and the problem still exists. Before all that, it was a steady flow of the serialplot which i want back ;-( any help is much appreciated.

SOLVED:

I just changed the buffer of the com port, and now it works again. Does the software changes this???

  Are you sure? yes | no

Hasan Yavuz Özderya wrote 02/23/2018 at 20:38 point

That sounds like a serious problem. Are you saying that 0.8 version doesn't have this problem but later versions have? I would be glad if you can create an issue in the bug tracker: https://bitbucket.org/hyOzd/serialplot/issues/ with more details such as data format you use and baud rate, and actual sample rate etc.

  Are you sure? yes | no

lysergicenemy wrote 02/17/2018 at 22:48 point

I've been searching for such an intelligent tool for a long time. I would like to see in future updates the ability to produce simple mathematical / trigonometric operations on input data arrays. Excellent application, success for developers!

  Are you sure? yes | no

Hasan Yavuz Özderya wrote 02/23/2018 at 20:33 point

Math operations are already in my todo :D Thanks for kind comment!

  Are you sure? yes | no

Arcu wrote 05/01/2018 at 12:53 point

Hi @lysergicenemy! Just wondering if you found something like that out there. Cheers!

  Are you sure? yes | no

lysergicenemy wrote 03/24/2019 at 10:21 point

yes, im using instrument Control Toolbox in matlab/simulink. It make possible plotting serial data for custom frame such as in this app and use any math operations on the input data ( this is the only thing I miss in the SerialPlot ), but this path slowely because need start/stop simulation and other unnecessary actions (for some reason matlab distorts data at high speed while SerialPlot displays normally).

  Are you sure? yes | no

Chris wrote 02/13/2018 at 12:38 point

Great tool.

I would like to add a feature request to display the live data in a histogram format, ideally with configurable 'bucket' sizes, but even displaying a tally for each count value received would be really useful. This would be useful for characterising measurements from a stable source.

Additionally, statistical metrics, such as min, max, mean would be useful.

  Are you sure? yes | no

Hasan Yavuz Özderya wrote 02/23/2018 at 20:39 point

That has been requested. And I have already started implementing the histogram feature but got in to some difficulties related to code quality. I'm in the middle of a small refactoring. After that it should be easy to implement. Please hold on tight.

  Are you sure? yes | no

RoGeorge wrote 02/09/2018 at 10:11 point

Hi, and Thank You.

You wrote a very nice and useful tool. Again, many thanks.

May I suggest a few feature requests, please? It's nothing critical, but I think it will be nice to have them in the future versions. These requests are coming from using SerialPlot to visualize the humidity and temperature coming from the serial port in CSV format, one line with humidity and temperature at each second. The 2 channels are displayed on a big monitor (desktop).

https://cdn.hackaday.io/images/6309021518173007112.png

Here are the feature requests:

1. Put the Y axis values on the right side of the screen, too, not only on the left side. This feature will come in very handy when plotting on a wide screen.
2. Possibility to edit the channel's name. It would be nice to have names, especially when plotting more than one signal.
3. A window with text (like a scrolling table), so the exact numerical value can be monitored, too.
4. If 3. will be implemented, then please add a timestamp column, too.
5. Possibility to put date/time on X axis.
6. Possibility to subsample (like e.g. the device is generating a CSV line each second, but plotting only 1 sample each minute, so a few hours or days can be fitted in one plot.
7. Possibility to set manual Y axis ranges for each individual plot in 'Multi Plot' mode.
8. Similar with DTR, RTS, etc. indicators, an Rx and Tx indicator, too.

  Are you sure? yes | no

RoGeorge wrote 02/09/2018 at 14:31 point

Just discovered request #2, channel renaming, is already implemented. Sorry for not RTFM first.
:o)

SerialPlot is running for a few hours now (Win10/I7), no bugs so far.

The ability to change the plot settings on the fly is gold, I love that feature.
Thank you.

  Are you sure? yes | no

Hasan Yavuz Özderya wrote 02/23/2018 at 20:47 point

"on the fly settings" has been one of my design goals. It's getting harder to abide by with every new feature but still I'm determined to stick to it! Thank's for kind comments.

  Are you sure? yes | no

Hasan Yavuz Özderya wrote 02/23/2018 at 20:45 point

I will consider #1, others has already been in my todo. Except #6. In the long term I want it to be possible to show very long data but how it is going to be represented is still a question in my mind.

  Are you sure? yes | no

Gokalp Cetin wrote 11/24/2017 at 13:24 point

Hello Hasan,

Great project truly, but I realized a small bug kind of thing I think:

When I first took a couple of screenshots it was working without any problem but now when I take a screenshot it just shows me the line between 2 data points even though the screenshot setting is 1000 data points to show.

(I am using the program to see the data coming from STM32F4 Discovery Board connected to the PC via FTDI.)

Except for this it is a great program, nice effort !!!

Please help

  Are you sure? yes | no

Hasan Yavuz Özderya wrote 11/24/2017 at 14:29 point

Do you mean the "snapshots"? Because taking a screenshot usually has nothing to do with the applications but it's a functionality provided by the OS. You should get what you see.

Which version of serialplot are you using? There used to be some bugs with the snapshot viewer but I've fixed those in the 0.10 version.

  Are you sure? yes | no

Gokalp Cetin wrote 11/24/2017 at 15:18 point

Yes I mean snapshots, sorry couldn't remember the name so wrote screenshot by mistake.

I am currently using 0.9 and now that I saw your comment I couldn't figure out how to download 0.10 version from here.

Could you please help me 

I am a noobie on hackaday.io

-------------------------------------------

Never mind I found it

I will try this one and if problem is no longer I will be so thankful.

Thank you so much

  Are you sure? yes | no

Hasan Yavuz Özderya wrote 11/24/2017 at 20:35 point

I'm pretty sure v0.10 will work for you. Because I fixed that specific bug. For the record all downloads can be accessed from this page: https://bitbucket.org/hyOzd/serialplot/downloads/ Latest versions are usually linked in the sidebar of this project page.

  Are you sure? yes | no

ishy wrote 11/10/2017 at 21:11 point

Hi Hasan,
Thank you for the time and effort you put into Serialplot. It worked flawlessly for a 3-phase metering project where I needed to display in real-time 3 channels of raw 16-bit signed ADC data. My ADC sampling rate was 3.9ksps and UART was running at 500kbaud. Being able to set up custom frames separates your software from most others. Very nice work, thanks again!


  Are you sure? yes | no

Hasan Yavuz Özderya wrote 11/23/2017 at 11:50 point

I'm happy to be helpful. Thanks for your nice comment. Also thanks for providing information. Such data is important when I'm thinking about design and optimization of the SerialPlot.

  Are you sure? yes | no

djordje.stojic wrote 11/01/2017 at 11:38 point

Hi, I tried to run the latest release 0.10 on WinXP and it failed to start.

Regards

  Are you sure? yes | no

Hasan Yavuz Özderya wrote 11/23/2017 at 11:49 point

I will try to look into this, if I can find my win XP virtual machine. Sorry but I cannot promise anything. Maybe you can provide more details?

  Are you sure? yes | no

djordje.stojic wrote 11/23/2017 at 13:06 point

When I start the SerialPlot 0.10 version on WinXP virtual machine I get the following responses: "Entry Point Not Found" and "The procedure entry point _except_handler4_common could not be located in the dynamic link library msvcrt.dll".

The SerialPlot 0.9 version works fine on the same virtual machine.

Regards

  Are you sure? yes | no

Hasan Yavuz Özderya wrote 11/24/2017 at 09:16 point

This looks like a build issue. I build serialplot on a windows 7 VM. I think I will have to build on a winXP machine. I will look into this.

  Are you sure? yes | no

Hasan Yavuz Özderya wrote 11/26/2017 at 11:50 point

i'm sorry, but i don't have a winxp VM that i can use to build SP at the moment. Creating a build environment for windows takes me hours, i don't have good internet connection. If you consider building from source yourself, let me know. I will try to help.

  Are you sure? yes | no

djordje.stojic wrote 10/31/2017 at 09:13 point

Hi Hasan, SerialPlot is a great program, thank you for your work. 

I have, also, a suggestion for some future releases - is it possible to increase the baudrates for SerialPlot since the maximum value currently allowed is 256000. 

Could, you, also, include values up to, for example, 921600, which is allowed by Windows.

This would be very useful in some fast and data extensive transfers from microcontrollers.

Regards

  Are you sure? yes | no

Hasan Yavuz Özderya wrote 11/23/2017 at 11:47 point

You can enter a custom value into the baud rate selection box even if its not listed.

  Are you sure? yes | no

djordje.stojic wrote 11/23/2017 at 13:02 point

Thanks

  Are you sure? yes | no

Malik Enes Şafak wrote 10/29/2017 at 16:38 point

Merhaba. Uzun zamandir benzer bir program ariyordum. Tesekkurler :)

  Are you sure? yes | no

Hasan Yavuz Özderya wrote 11/23/2017 at 11:52 point

Memnun oldum.

  Are you sure? yes | no

Juan Perez Estrada wrote 09/26/2017 at 21:50 point

Hi, Hasan, I have checked your 0.10 version. I works great with an arduino leonardo. Thanks a lot. Also plot options are very good to improve the app. I hope you will post new version soon, I think it will be improved also a lot. Thanks a lot !!!!

  Are you sure? yes | no

Hasan Yavuz Özderya wrote 09/27/2017 at 07:00 point

Hi Juan, thanks for feedback and nice comments.

  Are you sure? yes | no

Juan Perez Estrada wrote 09/27/2017 at 20:57 point

I get managed to do a simply oscilloscope with this soft, a arduino leonardo and a ADC fast converter. More than 6000 sps. I hope you will go on to update the app, thanks a lot.

  Are you sure? yes | no

Juan Perez Estrada wrote 08/24/2017 at 16:54 point

Hi, please in your new version, expose DTR flag. Arduino Leonardo needs it to be true. 

Also you can also expose Rst flag.

Do you have some date to the new version? Could you please make this little change (add DTR flag) ?

Thanks a lot

  Are you sure? yes | no

Hasan Yavuz Özderya wrote 08/24/2017 at 18:00 point

This has been requested already (for the same reason), and I had it implemented. But it wasn't complete due to a lack of API. I will try to add it to the next release as it is which should come in a week or two. It won't be big but it will come with some performance improvements.

  Are you sure? yes | no

Juan Perez Estrada wrote 08/24/2017 at 20:14 point

Great !!!

  Are you sure? yes | no

Juan Perez Estrada wrote 07/26/2017 at 12:52 point

Hi, thanks a lot for this great piece of software. I have just installed windows 64 bits version and use the demo. I am on holidays and I don't have any arduino/esp8266/... near me.

I want to ask you several things. May be some of them are great for other people and you could try to add to your todo list.

I want to use your software to do a poor man oscilloscope (with and ATMEGA32U4, Xadow board).

1. I have read about a suggestion of introducing the ability to multiply incoming data from the channel by a constant. Also and offset (positive or negative)

2. Could it be possible to show in X axis the time down the sample number ? I mean, the time in which you program recieve the data. I know that it will be not very precise, but may be someone finds it usefull. 

3. Or an option to show the time but applying a factor to the sample number. For example a factor of 0.001 will be a 1kHz sample frecuency, or 1ms per sample. May be someone finds it usefull. (May be factor will me more usefull based in milisecons). User will chose this factor or the time that the software itselft calculates (as I ask for in the previous paragraph)

4. Make windows version portable. I don't know if it could be possible to have .exe and .ini in the same directory. So we can carry it in a pendrive.

Best regards,

NOTE: Sorry about my english, and about my newbie's comments.

  Are you sure? yes | no

Hasan Yavuz Özderya wrote 07/26/2017 at 12:59 point

Hey @Juan Perez Estrada thanks for your comment. #1 and #2 is in my TODO. But #2 is a long term goal at the moment. #3 is already possible. Switch to the "Plot" tab. Untick the "Index as X axis" , now you can set the beginning and end of the x axis to have the effect you described. #4 windows version works fine as a single exe, you can get it from the "program files". But it won't remember any settings obviously. I think it stores the settings in registry at the moment. I will look into implementing your suggestion of an ini file next to the executable.

  Are you sure? yes | no

Juan Perez Estrada wrote 07/26/2017 at 22:22 point

Great, great, great, and great, and also thanks thanks thanks and thanks. (probably not, but if you are developing it in Visual Basic .NET I can help you with a settings file next to the exe file).

  Are you sure? yes | no

Juan Perez Estrada wrote 01/21/2018 at 18:26 point

Hi @Hasan Yavuz Özderya , do you think that #2 will be implemented ? May be you haven't got more time to develop this great app rigth now ? I dont know anything about Qt framework, but I will be great that, at least, the log file save also the miliseconds or microseconds when the PC has received the data. Hope your answer and good news. Thanks a lot.

  Are you sure? yes | no

Hasan Yavuz Özderya wrote 07/27/2017 at 06:43 point

FYI SerialPlot is developed with C++ using Qt framework.

  Are you sure? yes | no

Hasan Yavuz Özderya wrote 01/21/2018 at 19:11 point

Juan I'm sorry but I cannot promise anything at the moment. I'm between jobs right now. Somewhat stressed :D I hope to speed up development after a month. #2 is a tough one because it requires changes to a lot of places in code. Serialplot isn't a big code base. But it's kind of a mess right know. And my priority is to fix the mess. Don't expect anything soon. Sorry.

  Are you sure? yes | no

Juan Perez Estrada wrote 01/21/2018 at 19:26 point

Perfect !!! Thanks a lot. There is also an option to publish the code in github or similar to get help from other people (I not :(  , as I dont know) But anyway, good luck with your job !!!

  Are you sure? yes | no

Sebastien wrote 07/13/2017 at 08:24 point

Hi,

Huge thanks for this tool, it is far better than any free or semi-free data-plotting tool out there. Simple to use, sleek, does the job. I've been using it 8 hours a day for the last few weeks.

If I may give you some suggestions and feedback:

-When using more than 10 channels, Channel 9 appears twice in the list of channels

-There's an option below the channels list to "Show all". You could replace this with "Show all/Hide all"  or add a second button, because when you have a lot of channels to monitor (I used 24 at some point :D), it's a pain in the butt to hide them all manually.

-A terminal that displays the received data would be great, instead of the small line in the status bar.

Hope that gives you some ideas. Thanks again, keep the great work!

Sebastien

  Are you sure? yes | no

Hasan Yavuz Özderya wrote 07/13/2017 at 08:33 point

Hello @Sebastien , I'm very happy when I see such comments :D thanks

Can you give specific instructions about the channel 9 problem, and maybe a screenshot. I can't reproduce it.

Ok, I will add show/hide as buttons.

Do you mean a window/panel for displaying plot data as text or stuff like debug text? Either way I have plans for both.

  Are you sure? yes | no

Sebastien wrote 07/13/2017 at 08:42 point

Hello,

You're welcome, good work deserves to be rewarded !

Conditions for the channel 9 "bug" :

Baud rate 115200, Default parameters (No parity, 8b, 1 stop bit, no flow ctrl)

ASCII, 24 channels. I have multiplot enabled here, but the bug is here with superimposed plots as well.

Screenshot here https://ibb.co/bwbChv. Btw, using version 0.9.1, but this was already on 0.9.0

For the terminal, I simply mean a display such as in RealTerm, TeraTerm, or even the serial console in the Arduino IDE. It could be useful when wanting to reach a specific value (I was looking at zero-crossing point in a graph, seeing the actual data and not the plot could be nice, since you can't use two programs on the same COM port, as far as I know).

  Are you sure? yes | no

Hasan Yavuz Özderya wrote 07/13/2017 at 08:46 point

Hmm. When you set it to 24 channels, are there actually 25 channels listed? Or could this be a naming issue? Does it fix when you "reset names"?

  Are you sure? yes | no

Sebastien wrote 07/13/2017 at 08:56 point

There were actually 24 channels (according to the number list on the left), but since there were two Channel 9, the last channel was named Channel 23 instead of 24.

Clicking on Reset indeed fixes it, and now I can't replicate the bug anymore. Argh.

Even if I shut down the soft, relaunch, enter a number of channels < 10 and then >= 10, I can't do it anymore :(

I'll be on the lookout and try to gather more info about it!

  Are you sure? yes | no

Hasan Yavuz Özderya wrote 07/13/2017 at 09:40 point

Ok, I've figured it out :D It was impossible to reproduce once you set a number big enough. Because then, serialplot will store the channel name/color etc in the settings file. You can reproduce it if you delete the settings file (I have no idea where it is stored in windows), and set number of channels like this: 9 -> 10 -> 9 -> 11 .

I've also found the cause of the problem in the code and [fixed it](https://bitbucket.org/hyOzd/serialplot/commits/48e97ae578ae5f96868e33ecd293f42cb441ab01).

The workaround you can use until next release is to set the number of channels to 32 (maximum) and click "reset". Doing this once, should be enough.

  Are you sure? yes | no

Sebastien wrote 07/13/2017 at 09:47 point

Cool, glad I could help! Waiting impatiently for the next release :)

  Are you sure? yes | no

g1542658 wrote 06/18/2017 at 16:28 point

Hi, i want to ask how to display analog values from Arduino instead of binary? I want the graph to be plotted in 0 to 1023 range

  Are you sure? yes | no

Hasan Yavuz Özderya wrote 07/13/2017 at 08:56 point

Hi @g1542658 I'm sorry I missed your comment (hackaday has problems with notifications)

I think you mean plotting from text output of arduino. You can use ASCII mode, selected from Data Format tab.

  Are you sure? yes | no

Andres wrote 05/16/2017 at 11:16 point

Hey man! I'm still using this program because it's amazing for debugging and tuning.

I'm now using itfully, with a custom frame and sending commands.

I've noticed  small bugs in the commands section:

When reopening the program (or loading settings) the commands are still there. But the ASCII option is selected by default (I was using HEX commands), the problem is that if I click HEX button it converts the message which was ok in hexa. It's treated as ASCII and converted to hexa. Solution is to copy the command, click hexa, delete the conversion and paste. 

When adding a new command it has a number "Command X". X seems a bit unrelated to the command list, but that is unimportant. When you click the command to change it's name, the font becomes little and never grows again.  See image http://imgur.com/a/DUu51 . Command 1 was not clicked. Command 3 and 10 where clicked (like to change name) and they became small. I don't know why instead of Command 4 or 2, Command 10 was created but as said, completely unimportant.

------

I don't want to sound like asking or anything since this has been hugely helpful and I would still use it anyhow. I think it would be awesome if you could choose the number of plots in multiplot.

For example, I'm doing motor control and have 4 signals. The reference angle, the measured angle. The reference current, and the measured current. For something like this it would be ideal to have 2 plots. One with measured/reference angle, and the other one with current.

Right now I just scale it in the microcontroller so they have a similar Y axis.

Thanks again!!

  Are you sure? yes | no

Hasan Yavuz Özderya wrote 05/16/2017 at 11:22 point

@Andres please do ask :) That's how open source projects get improved. Feedback is important. Especially negative feedback, I'm pretty sure you already know that ;)

I will look into the bugs you mentioned.

Multi-plot features you are asking for, are definitely planned. But it's going to take a bit time before I get there.

  Are you sure? yes | no

Robert Smith wrote 05/13/2017 at 17:00 point

I have a dumb question.  I just downloaded 0.9.0.  I have data in CSV format terminated by a <CR> a typical line looks like this:

-12,-149,-340,-640,-829,22,-833,26,

I have set the data format to ascii number of channels =8 and there is no plot.  I have set the range to signed 12 bit as none of my data exceeds 12 bits

If i set it to binary, of course it plots lots of garbage as the data is ASCII.  Am i missing something?

I really can't use binary because there are times when i need to capture data to import to Excel, and CSV works the best.

  Are you sure? yes | no

Robert Smith wrote 05/14/2017 at 02:28 point

I should add that our system transmits 33 lines per second (ideally, 100 lines per second)

  Are you sure? yes | no

nhuong wrote 04/28/2017 at 17:26 point

Fist at all, thank you for great software, it helped me save a lot of time.

I'm confusing that how 'float mode' work when the software receive value through UART 8-bit ,

More specifically, I have a microcontroller and I want it send 32-bit floating point  number through UART and plot it in serialplot but I don't know how to configure it.

Sorry I can't read source code to find the answer.

Thanks!

  Are you sure? yes | no

Hasan Yavuz Özderya wrote 04/28/2017 at 20:47 point

@nhuong thank you for your kind comment.

"float" data should be sent in C standard float representation. So if
you have a floating point variable in your code you can transmit it
like this:

// example data to transmit
float number = 3.3;
// we use type casting so that float precision is not lost in conversion!
char* data = &number;
// transmit the 'float' just like it is a byte array
uart_transmit_array(data, 4);
// or per byte
uart_transmit_byte(data[0])
uart_transmit_byte(data[1])
uart_transmit_byte(data[2])
uart_transmit_byte(data[3])

I haven't tested above code. I hope it is clear to you. To configure SerialPlot for this kind of data:

1. Select "Simple Binary" from data format panel
2. Select "float" number format and make sure "Little Endian" is selected
3. Set number of channels to "1"

Remember "simple binary" mode as the name implies is very simple. Sometimes too simple. If a byte is missed during transaction for any reason, it cannot detect that. For this case there are "Skip Byte" and "Skip Samples" button. It is user responsibility to fix synchronization manually using those buttons. This was a very intentional design decision to keep the protocol as "simple" as possible.

Please let me know if you need further help.

  Are you sure? yes | no

nhuong wrote 04/29/2017 at 05:10 point

ok, I got the idea and I need your further help too :) 

I'm devoloping a real-time DSP project, so I trigger ADC to sample at 30K samples/second, and then the data will be processed by DSP algorithm that produce 30K x 32 bit data per second ( my clock source is 80MHz) . If I have to split each data by 4 to transfer with UART, it's mean 4 frames x 10 bits per data or 30k x 40 bit per second or 1,200,000 baud rate. It's impossible!

Did I miss something? If not, should I convert the data to char ( reduce the precision)

Anyway, thank for your quick reply!

  Are you sure? yes | no

Hasan Yavuz Özderya wrote 04/29/2017 at 05:58 point

1.2Mbaud is possible. Desktop RS232 ports may or may not support it. But most UART-USB converters I've seen does. If you are using Virtual UART (CDC) over Full Speed USB, it should be possible.

I'm not sure if SerialPlot can handle 30k samples though : ) I'm curious too.

  Are you sure? yes | no

nhuong wrote 04/30/2017 at 03:22 point

serialplot worked well at 1.2M baud :) ,

Sadly, I have another problem, serialplot just plot the value it received and shift from right to left( time graph) , i think it's not good for my project, I need plot frequency of signal, it's mean the software need to hold N values and then plot it in one time ( not shift from right to left)

Maybe I should try something else :)

Thanks for your kindly help, have a nice weekend !

  Are you sure? yes | no

Andres wrote 05/16/2017 at 10:15 point

I'll squeeze in here, hope you don't mind.

It can certainly handle 30k samples and more. I'm using 1Mbaud right now, but have used up to 2Mbaud. 2Mbaud was problematic but I'm not sure if it was the USB-serial or the SerialPlot.

I've maxed the capacity of the 1Mbaud which is roughly 110kbps (or 14kBps) and the SerialPlot handles it well in my XPS15 notebook up to 1000 Number of Samples, or so.

  Are you sure? yes | no

Hasan Yavuz Özderya wrote 05/16/2017 at 10:23 point

@Andres happy to hear that :D thanks for letting me now.

  Are you sure? yes | no

Hasan Yavuz Özderya wrote 04/30/2017 at 06:21 point

@nhuong yeah, that's not possible at the moment. I'm thinking about adding a command interface to serialplot. So you can send a "clear plot"  command from the device. Do you think this would help your use case?

  Are you sure? yes | no

nhuong wrote 05/01/2017 at 11:37 point

I don't think "clear plot" would help me plot spectrum :))

  Are you sure? yes | no

Hasan Yavuz Özderya wrote 05/01/2017 at 11:48 point

Let me clarify. Let's say your X axis is 1000 samples long.

1. Set plot width (number of samples) to 1000
2. Send clear command
3. Send 1000 samples
4. Repeat from step 2

Provided this happens very quickly you could see something representing the frequency spectrum.

  Are you sure? yes | no

nhuong wrote 05/01/2017 at 11:55 point

But the when plot, data will shift from right to left, and when this happen quickly, I guest you won't see anything

  Are you sure? yes | no

Hasan Yavuz Özderya wrote 05/01/2017 at 12:33 point

Well you have to put some delay in between frames. But I agree this sounds to much like a hack. If instead of shifting from right to left we always plot from left to right it would look better. But with current code it's not easy. I'm working on some improvements. Then I will look into this.

  Are you sure? yes | no

Similar Projects

Does this project spark your interest?

Become a member to follow this project and never miss any updates