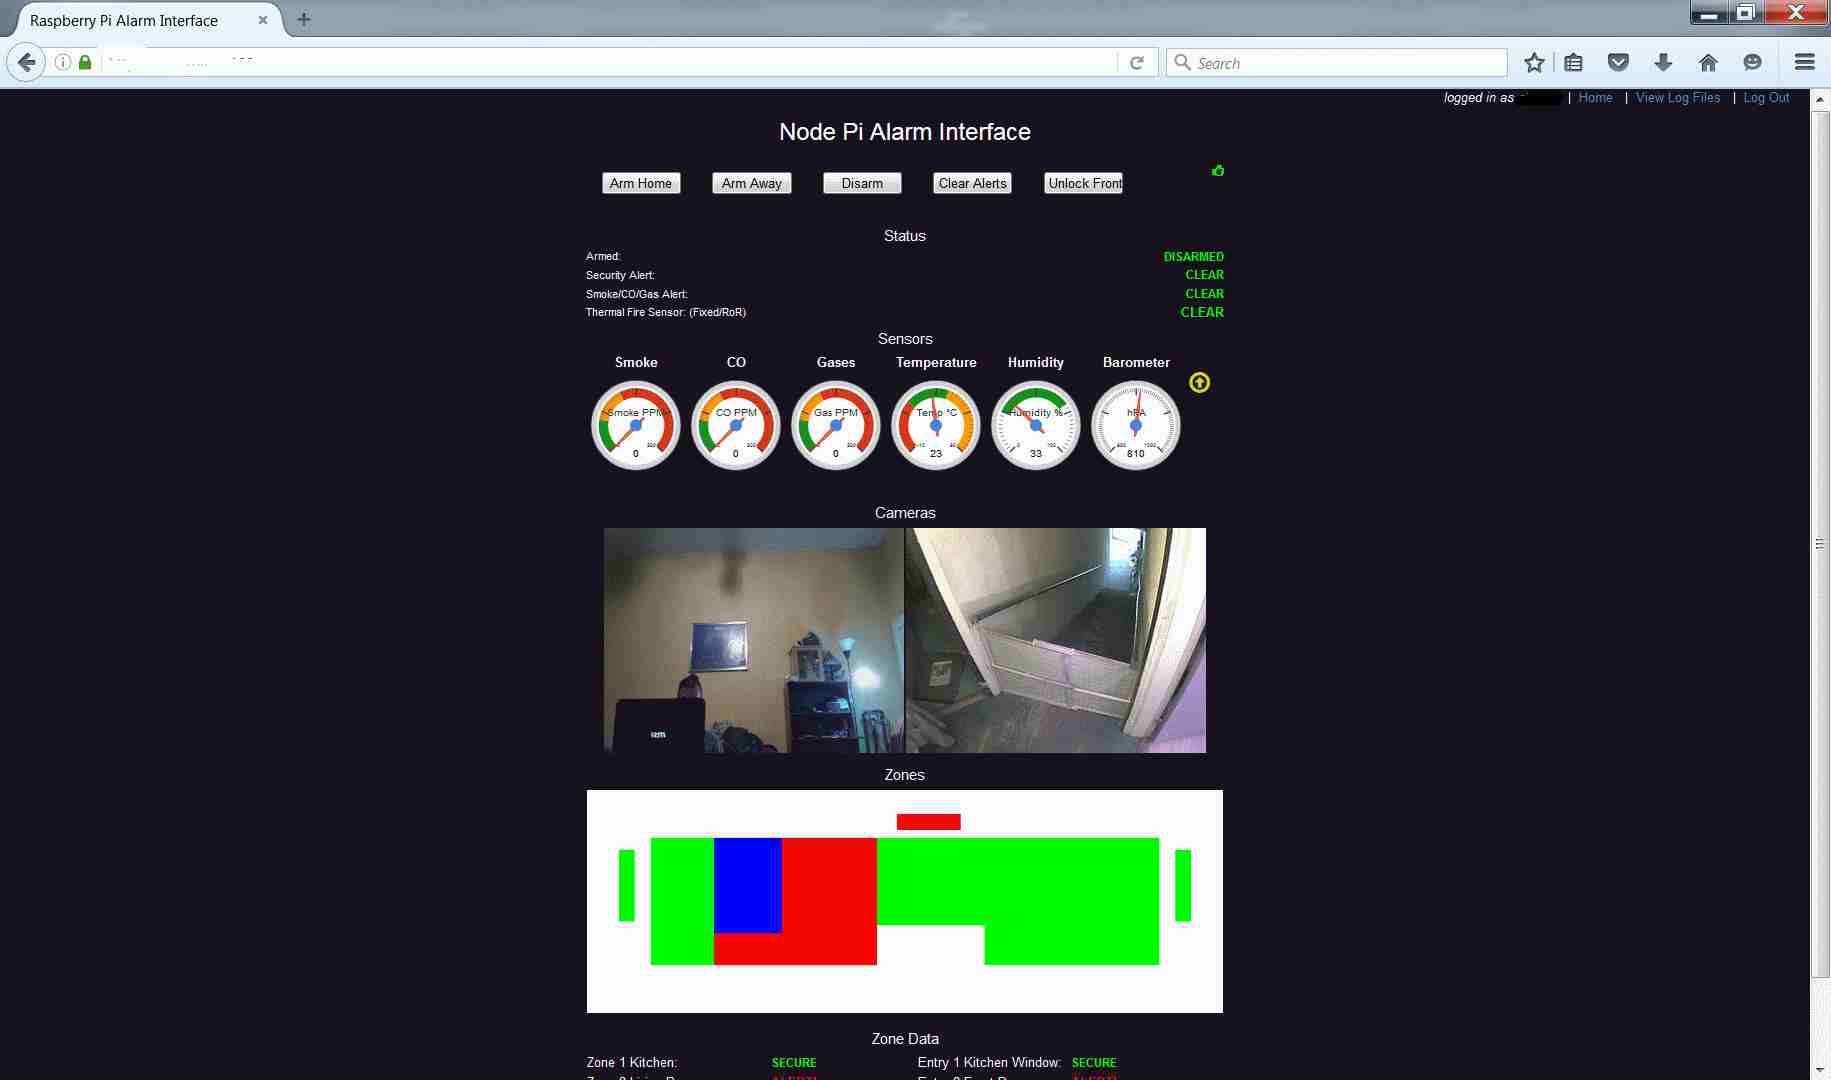
• Sea Level Barometer Adjustment Added

    Alpha Charlie06/07/2016 at 16:32 0 comments


    When I first wrote the application I set it to use absolute pressure. While accurate, this put it 'out-of-whack' with local weather reports. (I live at almost 2000m altitude). So since I was meddling with the code and adding the gauges, I figured I'd correct the barometer as well. To do that we use the following formula-

    in java script, this looks something like -

    var seaLevelPress = rawPress / Math.pow(1.0 - (0.0065 * altitude) / (temp + 0.0065 * altitude + 273.15, 5.257);

    To capture the barometer trend, I'n keeping 2 averages of pressure, a short average and a long average. The short average gives me the average pressure over the last 10 minutes. the long average gives me the average pressure over 8 hours. (measurements are taken and added to the rolling averages every 2 minutes). If the short average > than the long average then pressure is rising and vice-versa... It's not perfect, but it seems to work.

    Note* - Due to how/where my system is mounted (i.e - on the back of my TV) It runs about 3 degrees hotter than the ambient temperature. I found I had to adjust for this in my sea-level pressure calculation as you can see in the photo below. (two variables altitude [in meters] and tempOffset [degrees C] are declared at the beginning of the file)

    Hopefully this helps anyone messing with the BMP085/BMP180.

  • New UI Design

    Alpha Charlie06/07/2016 at 02:39 0 comments

    New UI

    Above is a screenshot of the new UI design. It still uses Node.js but some things have been added. The text display of sensor data has been depricated in favor of gauge controls from Google Charts. This is part of a design trend in this application of using graphical data along with (or instead of) text as much as possible. The 6 gauges are labeled and color-coded and to the right of the Barometer, there is an icon which indicates whether the pressure is rising, falling or stable.