 Rajendra Bhatt
Easy Pulse Plugin is now also available for purchase in limited quantity on my Tindie Store.
An open-source, Arduino/Chipkit compatible, and breadboard-friendly pulse sensor
Already have an account? Log in.
To make the experience fit your profile, pick a username and tell us what interests you.
Easy Pulse Plugin is now also available for purchase in limited quantity on my Tindie Store.
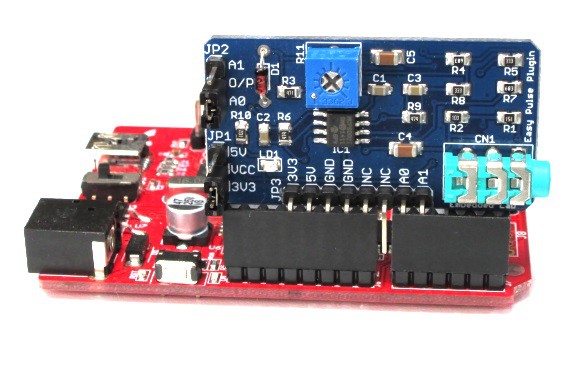
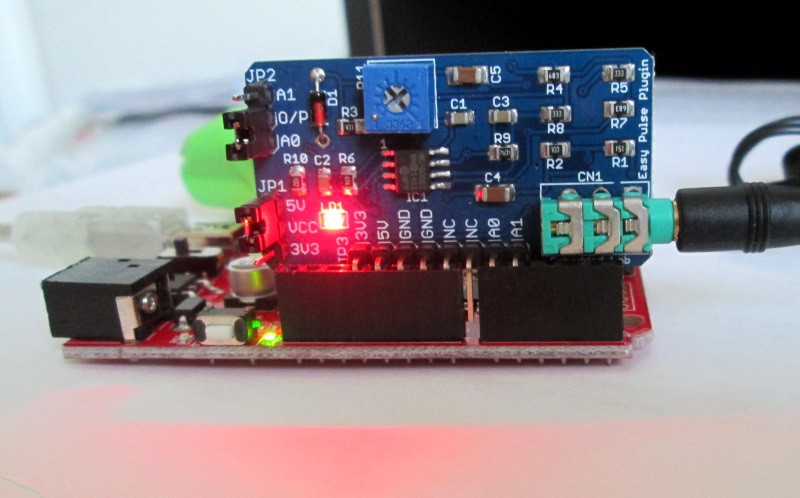
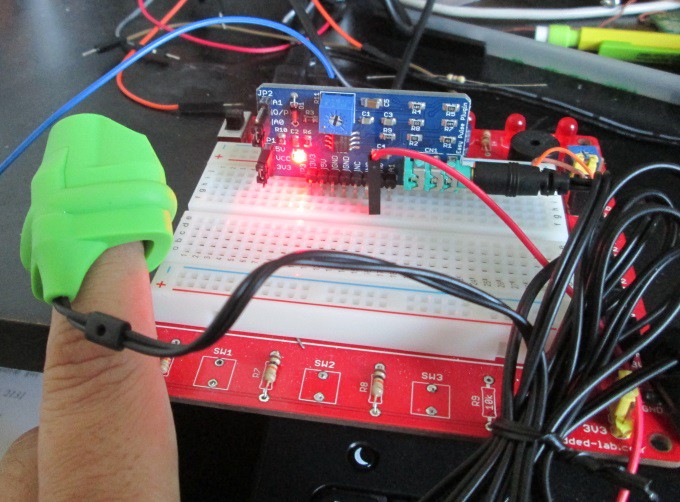
Easy Pulse Plugin offers an analog PPG output signal that can be utilized in numerous ways to retrieve the heart rate. One simple application would be connecting an LED (with an external driver circuit, which could be a simple transistor-based circuit) to its output and visualize the beating action of the heart. The LED will flash in synchronous with heart beat. A more advanced application would be digitizing the analog PPG signal for further processing by a computer and quantify the instantaneous heart rate. A simple example is discussed here. The setup below shows the pulse module plugged into an Arduino Uno board. The JP2 jumper is placed on the A0 position so that the PPG output can be fed to the A0 analog input of Arduino. While inserting the Easy Pulse Plugin on Arduino, make sure that the male pins of JP3 headers on Easy Pulse Plugin matches with those of female headers on the Arduino board. The JP1 jumper is placed on the 5V position, which means the Easy Pulse Plugin is powered by 5V supply from the Arduino Uno.
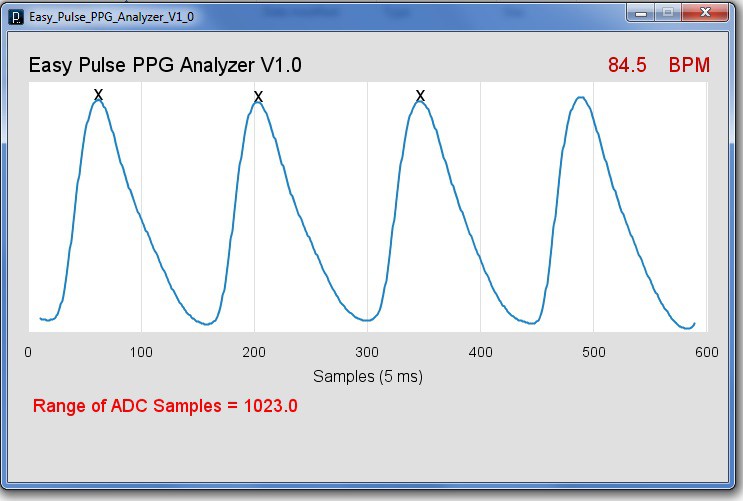
The Arduino Uno is programmed to read in the analog PPG input at A0, convert it to a 10-bit digital count, and send it to the PC through USB-UART interface for further processing. The input PPG signal is sampled at 5 milliseconds interval and transferred to PC at 115200 baud rate. A PPG analyzer software is developed using the open-source Processing Programming language, which receives the analog samples sent by the Arduino board and visualize the PPG waveform on a computer screen. By measuring the time intervals between three consecutive peaks of the PPG waveform, heart rate is computed and displayed on the same screen. A more detail description of PPG analyzer software can be found here.
The Easy Pulse Plugin circuit is tested with a 5V power supply. The HRM-2511E sensor is worn on the tip of the index finger and the signal waveforms at various stages of instrumentations are analyzed using Digilent's Analog Discovery tool, which features a 2-channel USB oscilloscope.
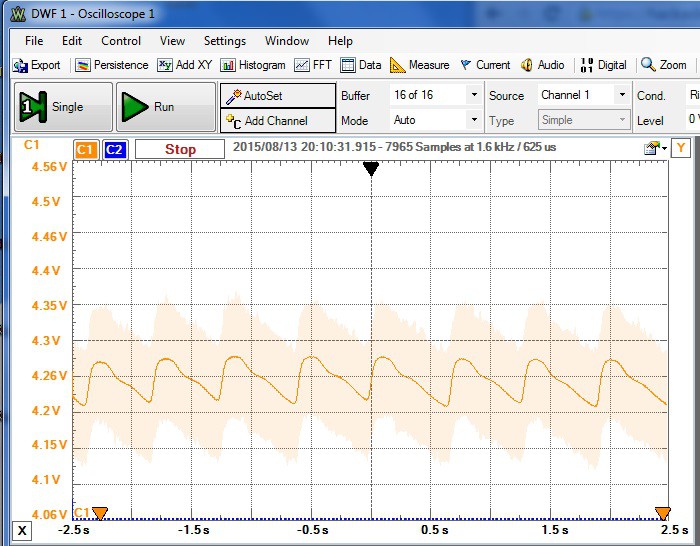
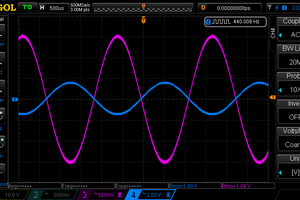
 The following figure displays the raw PPG signal output from the photodetector. The raw PPG signal is very noisy, as can be seen as a fainted image in the background of the main waveform, which is an averaged version of the raw signal processed by the Analog Discovery tool PC software. The signal is weak with a peak amplitude of ~60mV. The Sytolic and Diastolic peaks can be easily seen in the averaged waveform.
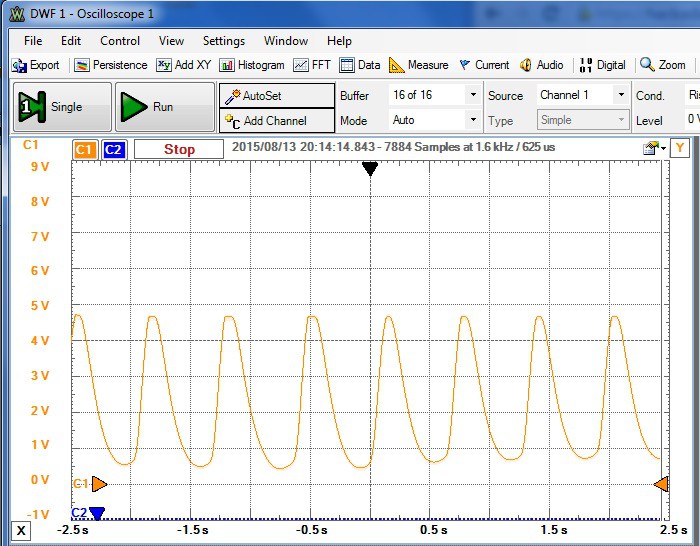
After two stages of amplification and filtering, the processed PPG waveform looks very smooth and exhibits a large dynamic range. The resulting signal thus looks perfect for a microcontroller's ADC input channel for further processing.
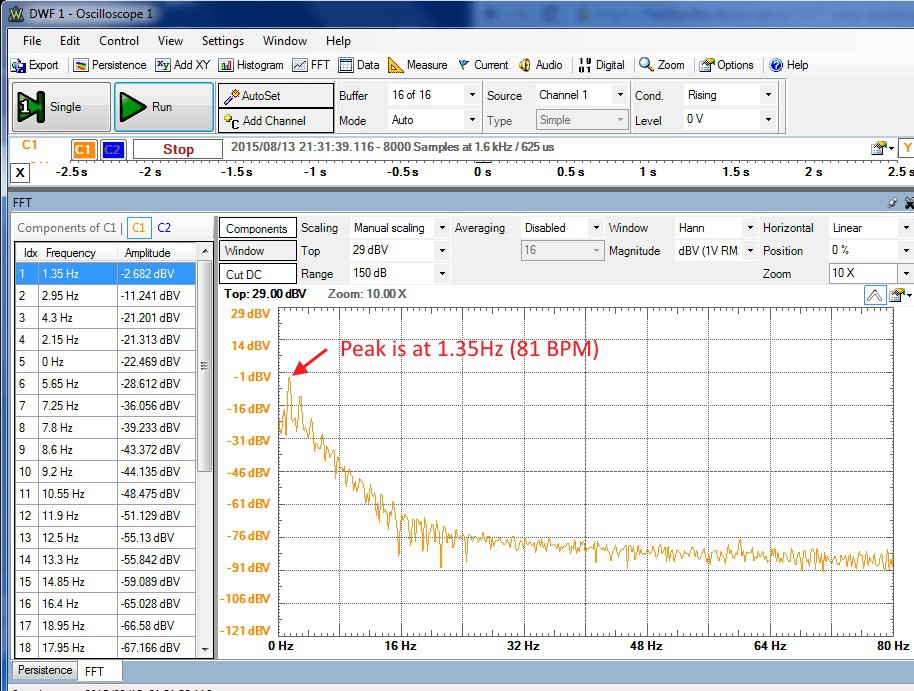
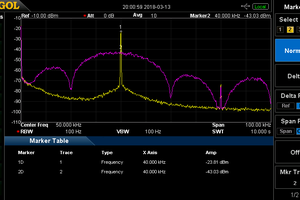
The Analog Discovery oscilloscope software tool also provides the Fast Fourier Transform (FFT) view of the input signal. The following picture shows the FFT output of the final PPG signal. The FFT peak corresponds to the fundamental frequency component of the PPG waveform, which is the frequency of the heart beat. In this example, the peak occurred at 1.35Hz, which is equal to 81 BPM (1.35*60).
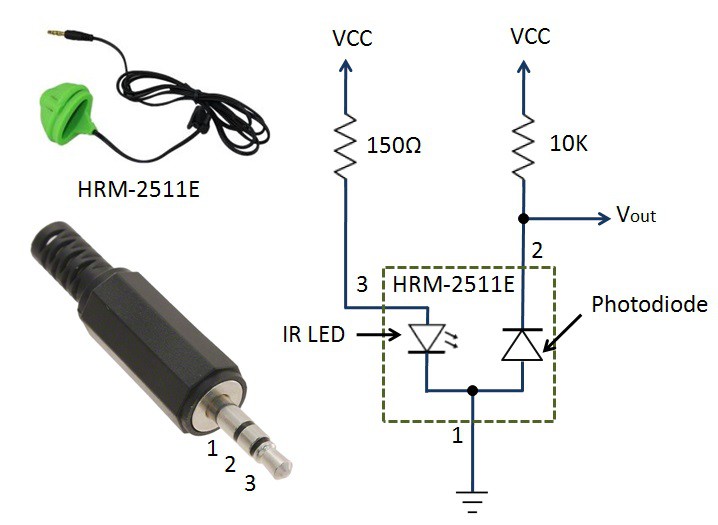
The following figure shows a basic DC biasing required for the HRM-2511E sensor. The sensor has three pins that are wired to a 3.5mm stereo audio connector. A 150 Ohm resistor is placed between VCC and the anode of the IR-LED to limit the current through the IR LED. Similarly, a 10K resistor provides a DC bias to the photodiode. The raw PPG output (Vout) from the photodiode is a very weak and noisy signal that swings about this DC bias voltage.
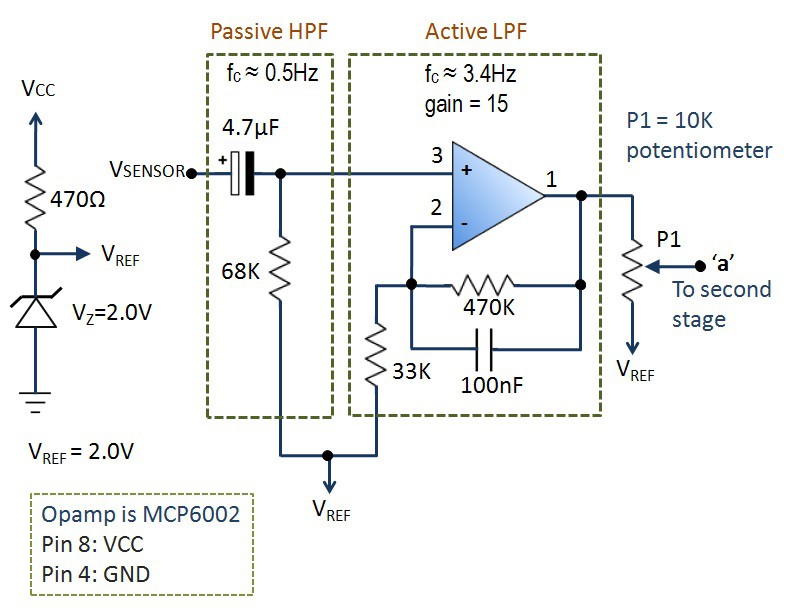
The photodetector output is passed through a 2-stage non-inverting instrumentation circuit built with Microchip's MCP6002 dual OpAmp chip. The two instrumentation stages are identical and have a maximum gain of 15 per stage (total 2-stage gain of 225). The negative input of the OpAmp is tied to a 2.0V reference voltage derived using a zener diode. This prevents the clipping of the negative swing of the PPG signal at the output. The instrumentation circuit is further divided into two parts: a passive RC high-pass filter (HPF) with a cut-off frequency of ~0.5Hz and an active low-pass filter (LPF) with a gain of 15 and a cut-off frequency of 3.4Hz. This constitutes a band-pass filter (BPF), which allows signals with frequencies between 0.5HZ and 3.4Hz. Therefore, it filters out the DC bias signal (which is 0Hz) in the photodetector output, as well as any high frequency noises (such as mains 60Hz frequency) present in the PPG signal. A 10K potentiometer at the output controls the amplitude of the output signal that is fed to the next stage of instrumentation.
The second stage (shown below) consists of the similar passive high-pass and active low-pass filters. The output of the second stage has sufficient dynamic range and can be directly fed to an analog input channel of Arduino or any other microcontrollers.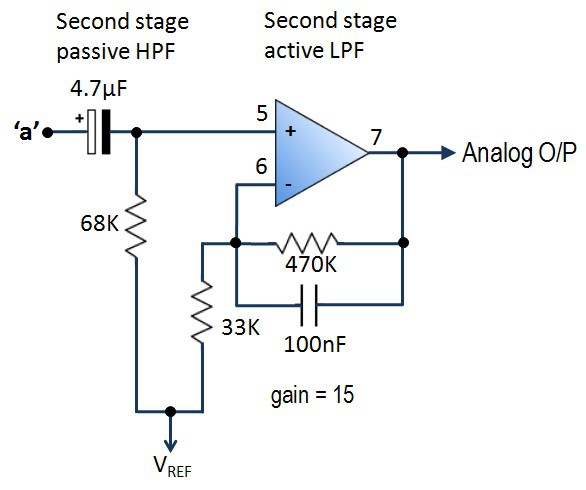
Transmittance and reflectance are two basic types of photoplethysmography. For the transmittance PPG, a light source is emitted into the tissue and a photodetector is placed on the opposite side of the tissue to measure the resultant light. Because of the limited penetration depth of the light through organ tissue, the transmittance PPG is applicable to a restricted body part, such as the finger or the ear lobe. However, in the reflectance PPG, the light source and the light detector are both placed on the same side of a body part. The light is emitted into the tissue and the reflected light is measured by the detector. As the light doesn’t have to penetrate the body, the reflectance PPG can be applied to any parts of human body. In either case, the detected light reflected from or transmitted through the body part will fluctuate according to the pulsatile blood flow caused by the beating of the heart. Easy Pulse Plugin uses the HRM-2155E optical sensor from Kyto Electronics Co., China. It operates in transmission mode. The sensor body is built with a flexible Silicone rubber material that fits well on the tip of a finger. Inside the sensor case, an IR LED and a photodetector are placed on two opposite sides and are facing each other. The following picture shows a basic setup for a transmittance PPG probe.
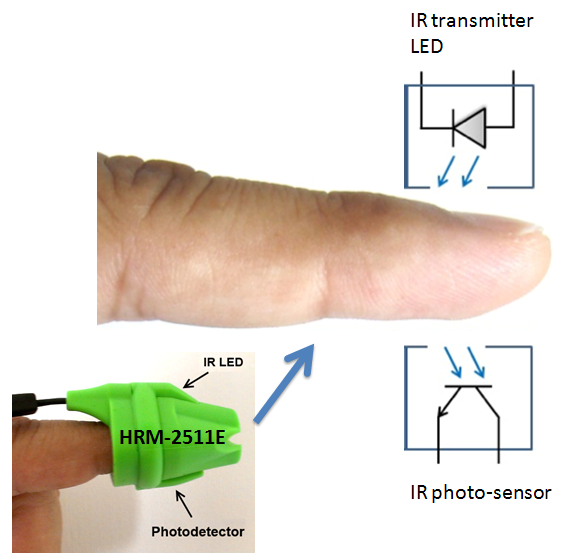 The amount of IR light transmitted across the finger depends on the blood volume in the tissue. The transmitted light intensity thus varies with the pumping of the blood from the heart, and therefore, is synchronous with the heart beat. A plot of this variation against time is referred as photoplethysmographic or PPG signal. The PPG signal consists of a large DC component, which is attributed to the total blood volume of the examined tissue, and a pulsatile (AC) component, which is synchronous to the pumping action of the heart. The AC component, which carries vital information including the heart beat rate, is much smaller in magnitude than the DC component. A typical PPG waveform is shown in the figure below (not to scale).
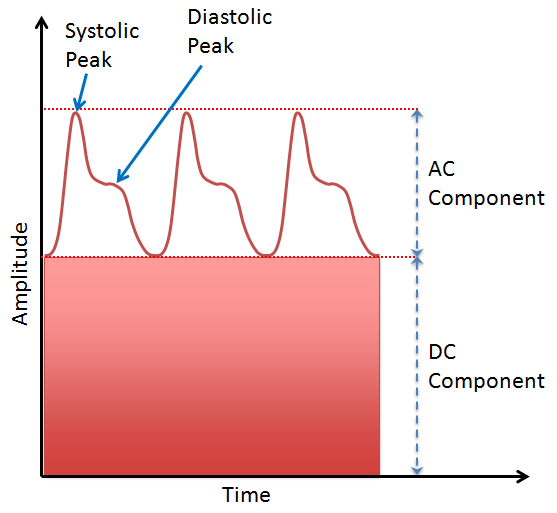 The two maxima observed in the PPG are called Sytolic and Diastolic peaks, and they can provide valuable information about the cardiovascular system (this topic is outside the scope of this project). The time duration between two consecutive Systolic peaks gives the instantaneous heart rate.

Hey bro.. i wanna ask.. how to get only the peak of signal ffrom this sensor in arduino ?
Hi hello
Can anyone tell me if(/how) can I measure/display the oxygen saturation in my blood with this tool ?
many thanks!

Don't forget to officially submit this to The Hackaday Prize https://hackaday.io/had2015
 Ted Yapo
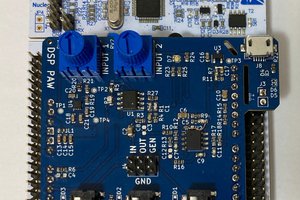
 Clyne
Clyne
 RoGeorge
Hi Raj, can you provide me with a schematic diagram for the circuit on the breadboard when connected to arduino UNO