 Radu Motisan
This project is a solution to monitor air quality parameters in Cities, compliant to international requirements on computing the Air Quality Index. The hardware is an IOT device equipped with a laser light scattering sensor for Particulate Matter PM2.5 and PM10, and 4 electrochemical sensors for Carbon Monoxide, Nitrogen dioxide, Sulphur Dioxide and Ozone. These 6 parameters are recognised as having a significant health impact by multiple countries, and are part of processes surrounding us in our daily activities. The connectivity is implemented via Wifi and LoraWAN, with two separate PCB versions. The connectivity fits multiple usage scenarios in city deployments.
The problem
Air pollution is the single largest environmental cause of premature death in urban Europe and transport is the main source. The 2008 Air Quality Directive, now under review, obliges member states to cut exposure to fine particulate matter by an average of 20% by 2020, based on 2010 levels.
The National Emissions Ceiling Directive caps some emissions including particulate matter (PM) and nitrogen dioxide (NOx) at national level. A revised version of the directive is as of 2016 under scrutiny by the Council of Ministers and European Parliament. Across the EU in 2013, nitrogen dioxide (NO2), which is mostly produced by traffic, caused 68,000 premature deaths. The Dieselgate scandal exposed how Volkswagen had gamed NO2 emissions tests.
Ozone (O3) killed 16,000 and small particulate matter (PM2.5) caused 436,000 deaths in the same year. PM2.5 particles, microscopic specks of dust and soot caused by burning fossil fuels, can enter the lungs and bloodstream. Air pollution has different particulate matter (PM) components – smoke, dirt and dust form coarse particles known as PM10 and metals and toxic exhaust from smelting, vehicle exhaust, power plants and refuse burning forming fine particles called PM2.5.
The CITY AIR QUALITY project
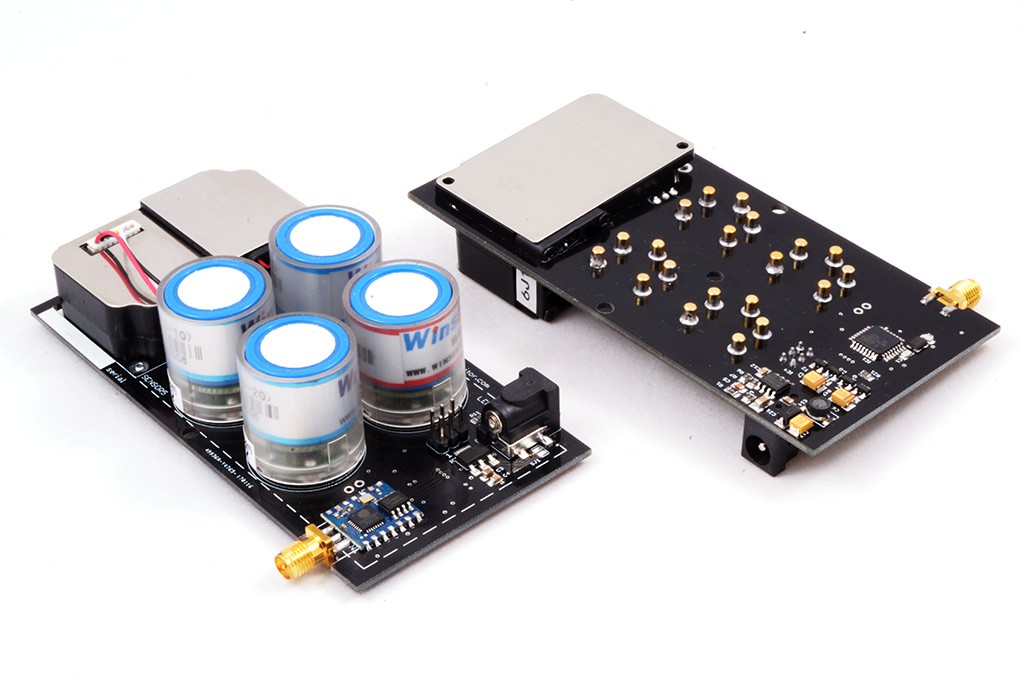
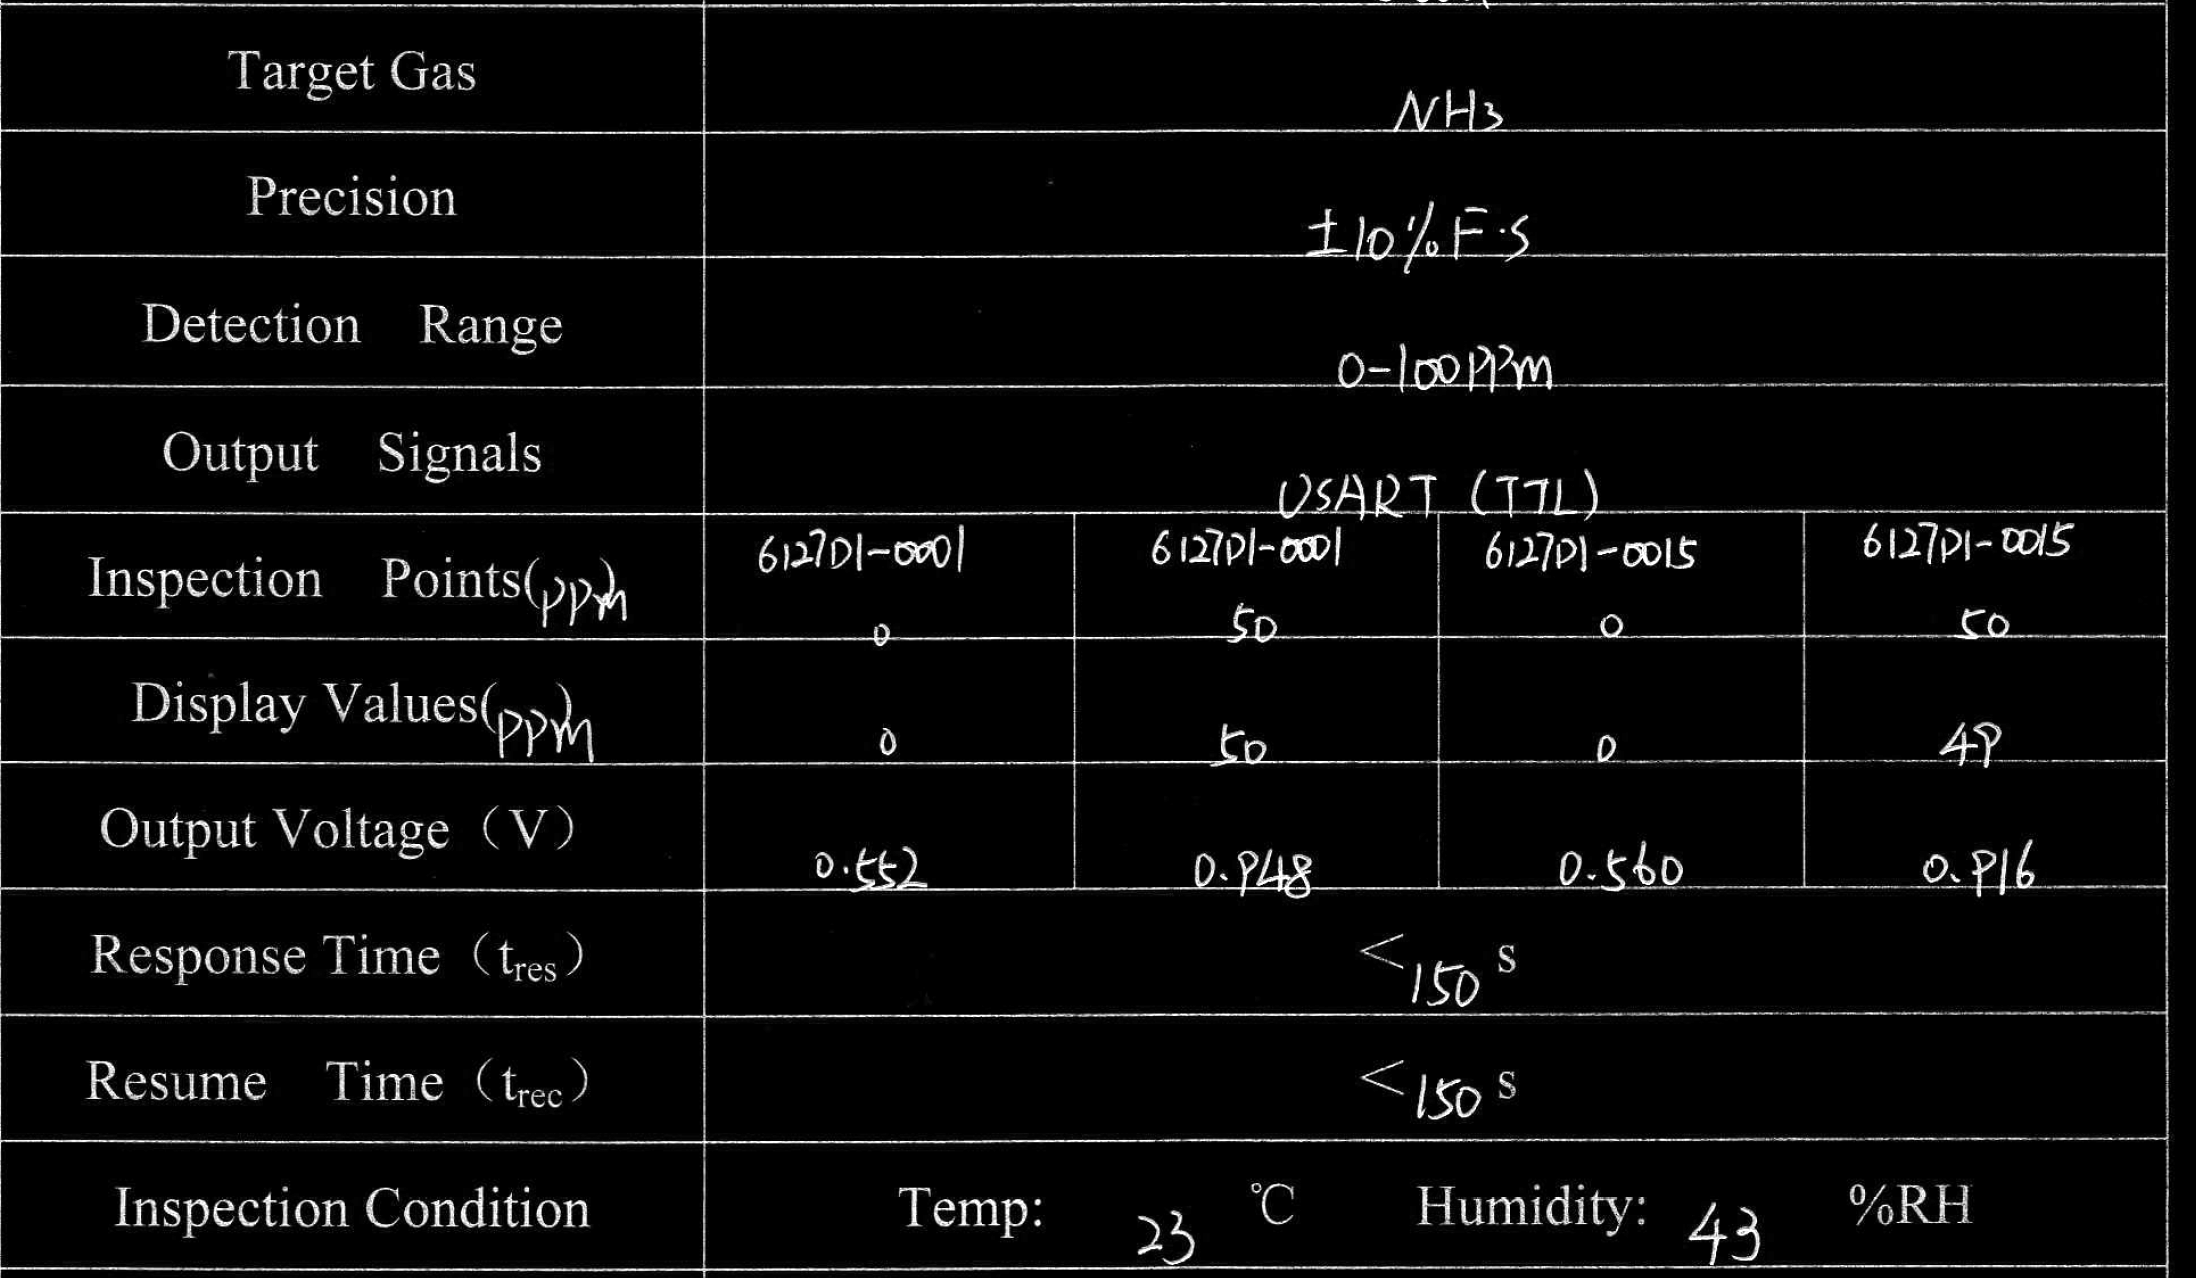
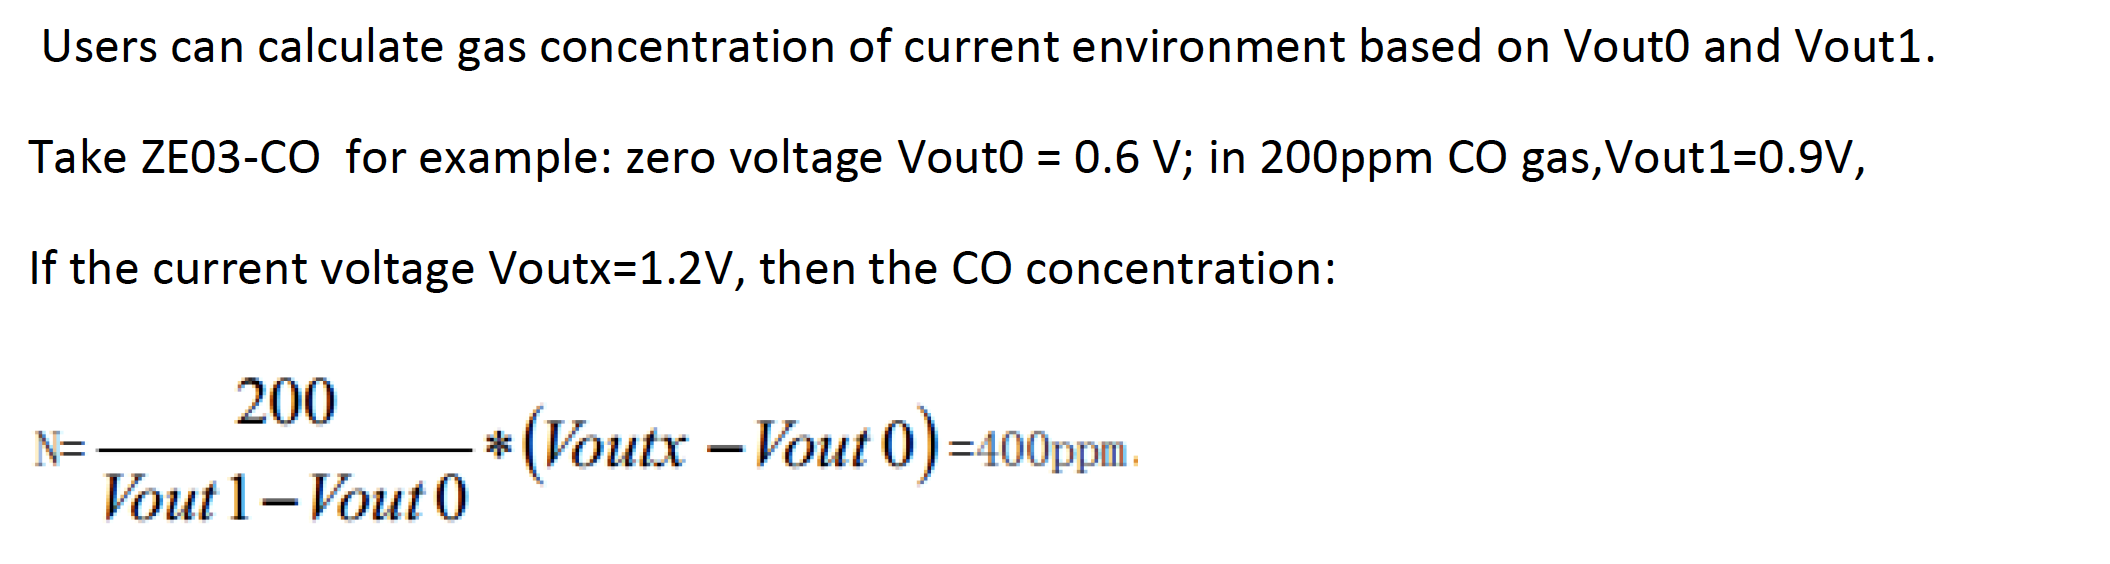
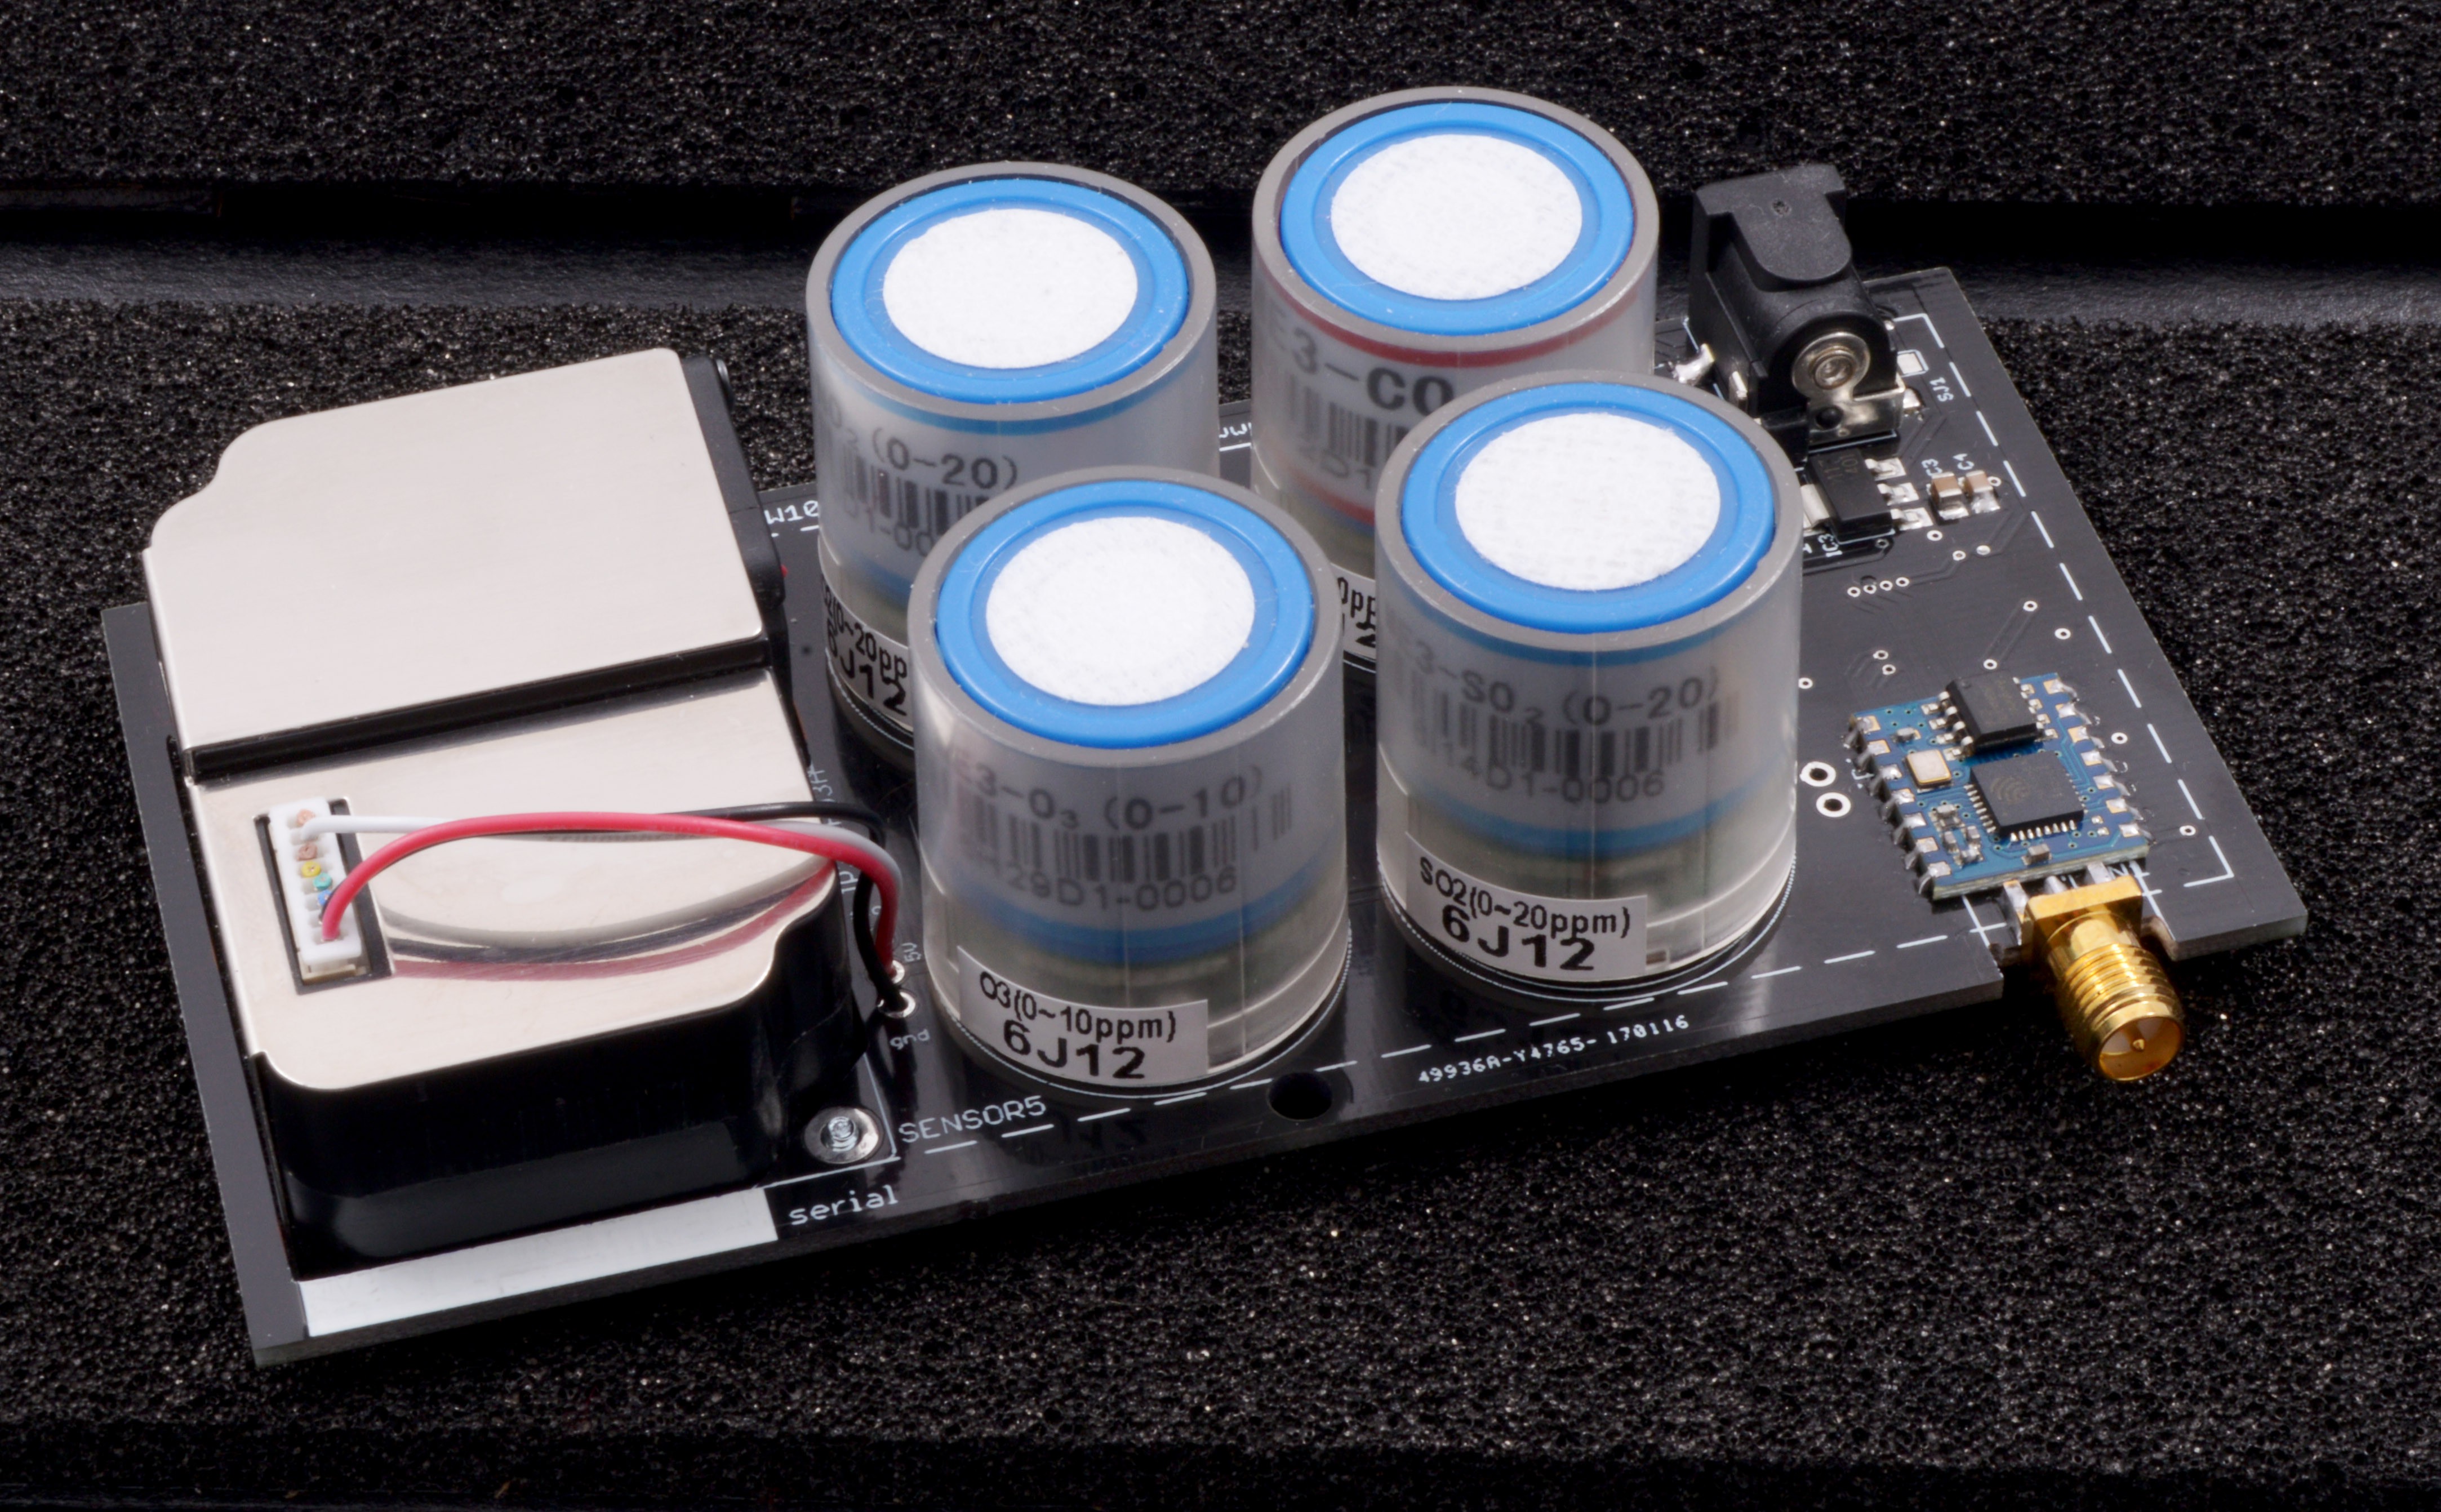
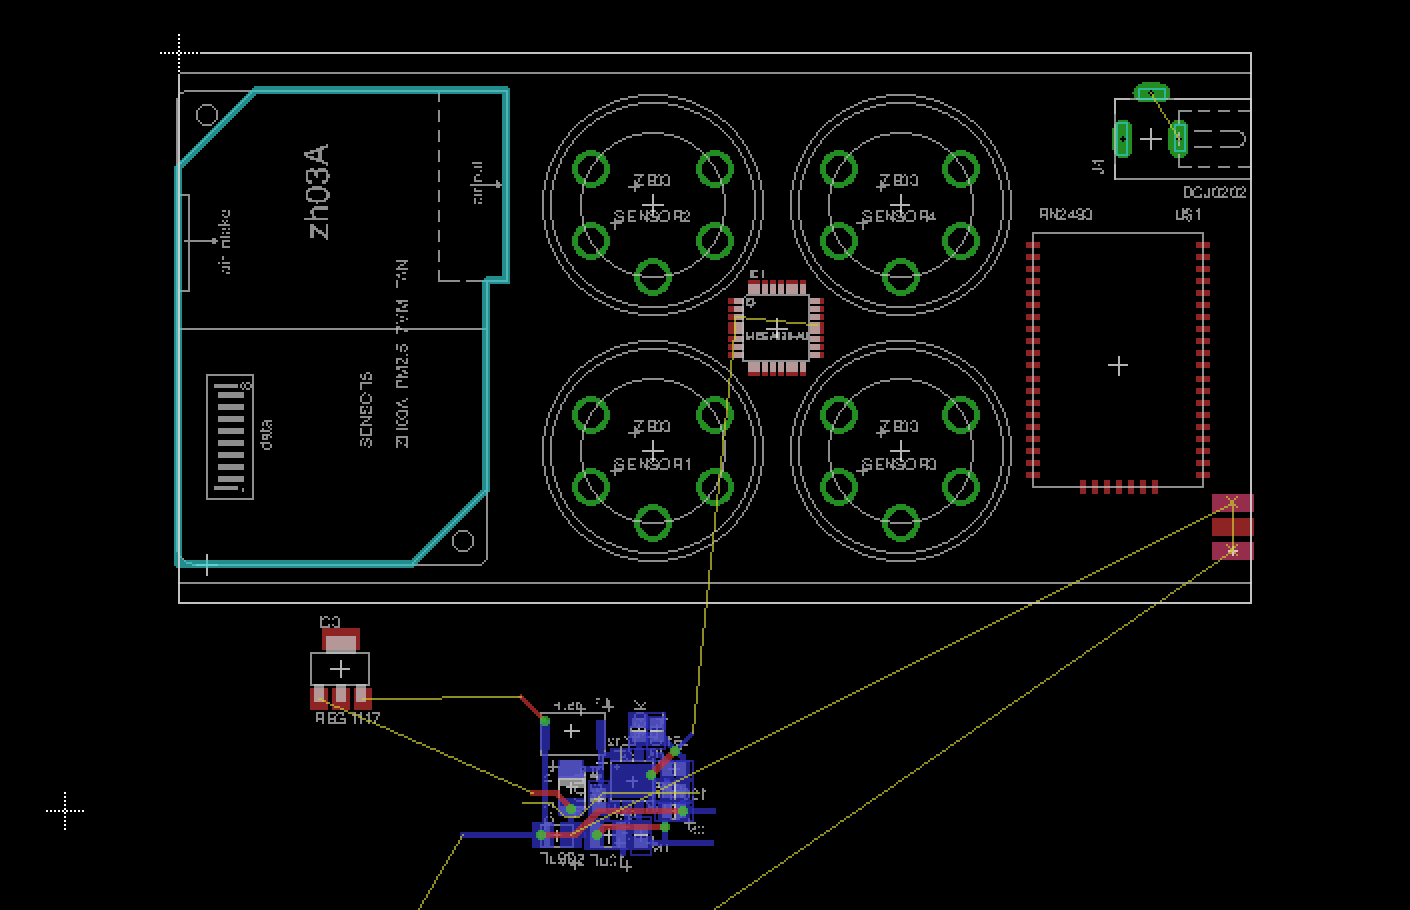
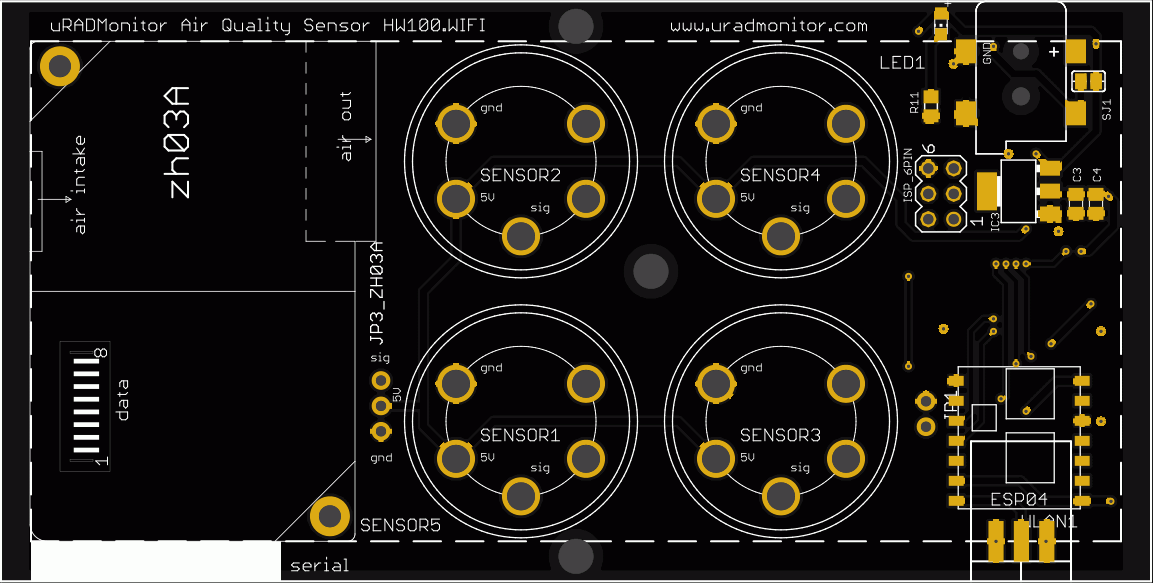
After several iterations, I have designed a product with 4 electrochemical sensors (4-series) for the 4 gases, and a laser scattering sensor for the fine particles. All sensors are individually calibrated in a test lab, and bare a unique serial number. Calibration data is inserted in the system, and used before presenting the data results. The electrochemical sensors have a lifespan of 2 years, so I designed the PCB with sockets where these sensors can be installed without soldering, so they can be serviced easily.
LoraWAN connectivity
This RF standard operating in 868MHz(EU) / 915MHz(US/Israel/Australia) offers low bandwidth long range data links at the cost of very low power. I had some experience with the RN2483 / RN2903 from Microchip so I went for those. While the specs indicate 15km in open field, ranges as high as 30km are achievable in some cases. The low bandwidth is sufficient for IOT applications, in this case sending 6 air quality parameters over the wireless link.
The Backend
The data goes to a server where it is modified against the calibration parameters, stored in a database for each sensor, individually, according to the test lab calibration sets. Therefore servicing sensors at the end of their life requires replacing them on the PCBs and changing the calibration numbers in a dedicated dashboard. This makes things very easy.
The server stores all data and offers it via a RESTful API interface. Plotting charts, doing stats or building City Dashboards becomes easy this way.
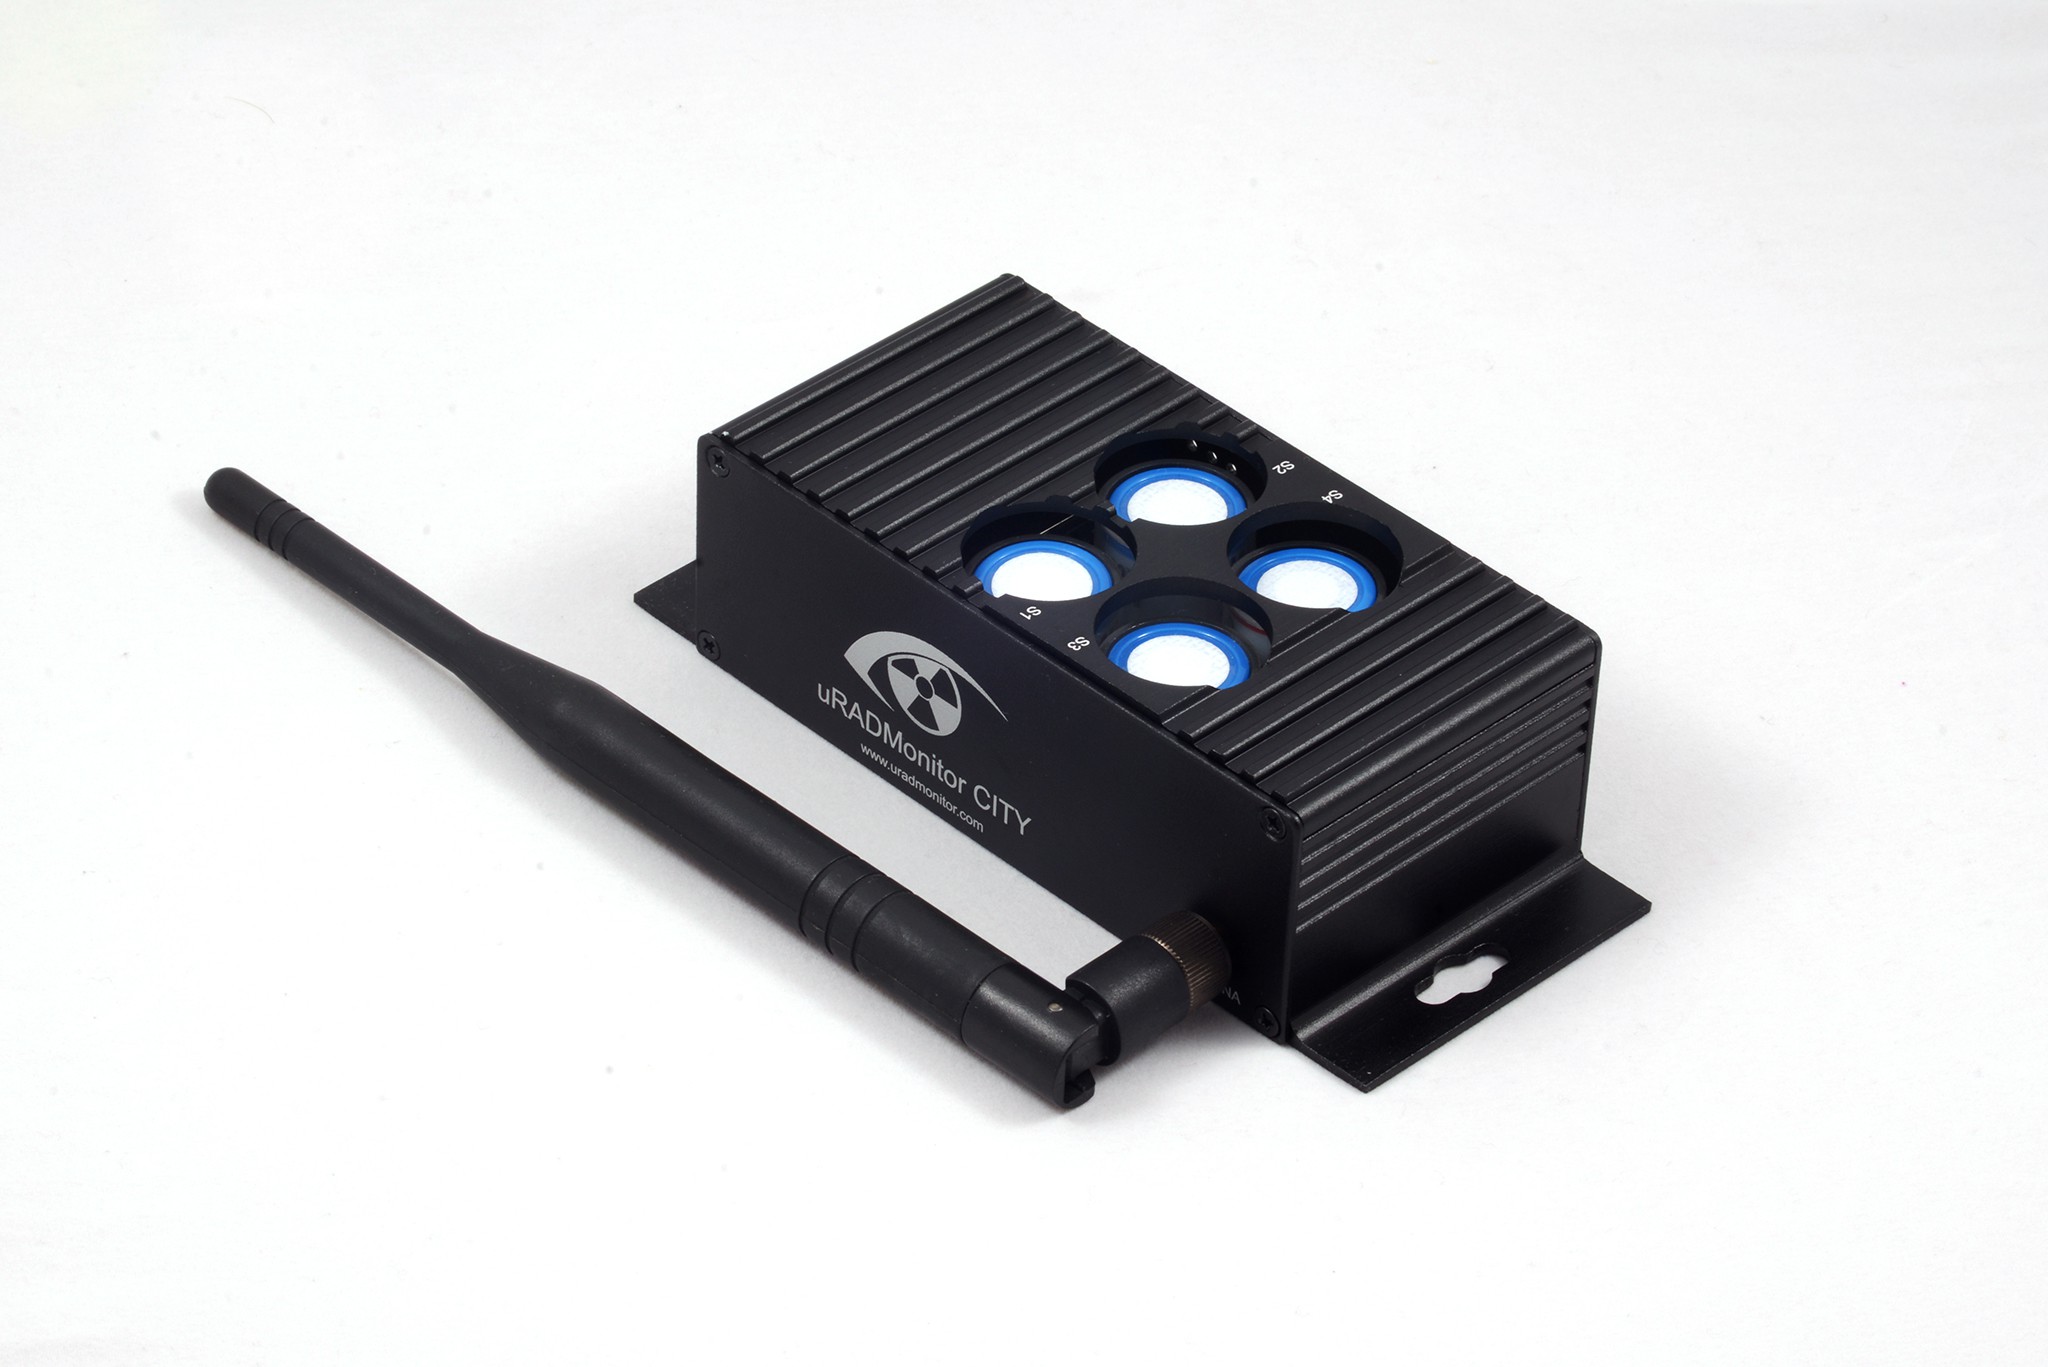
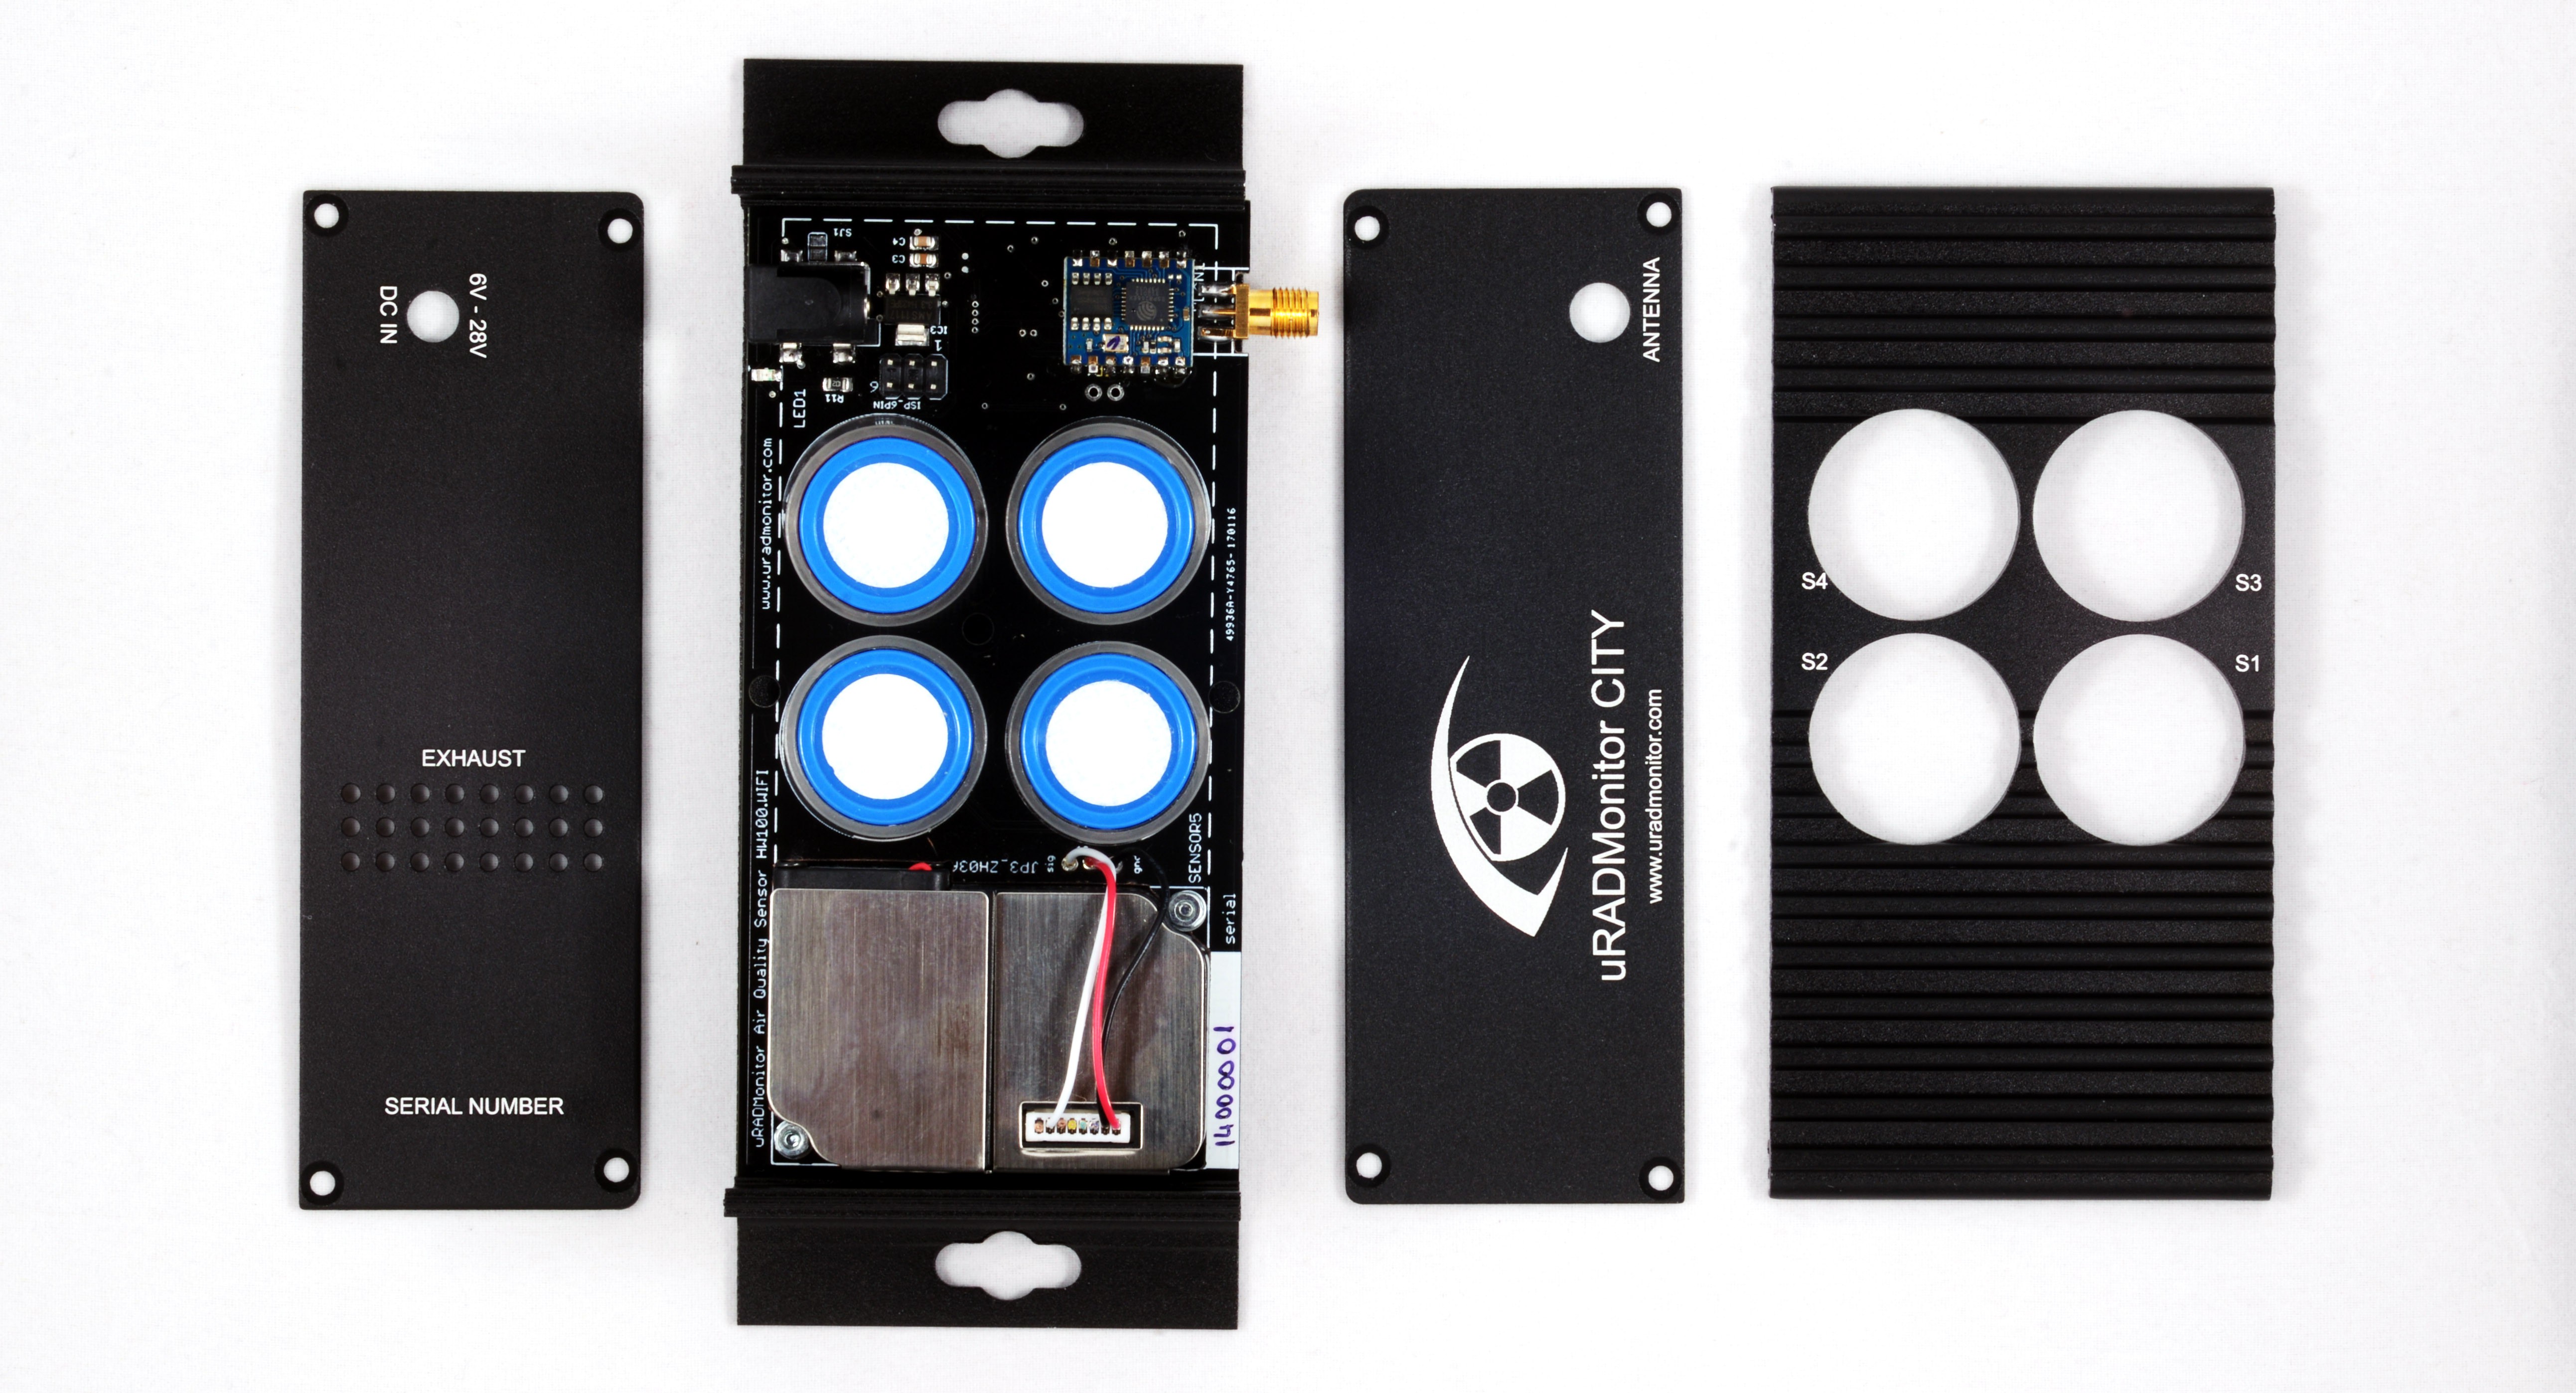
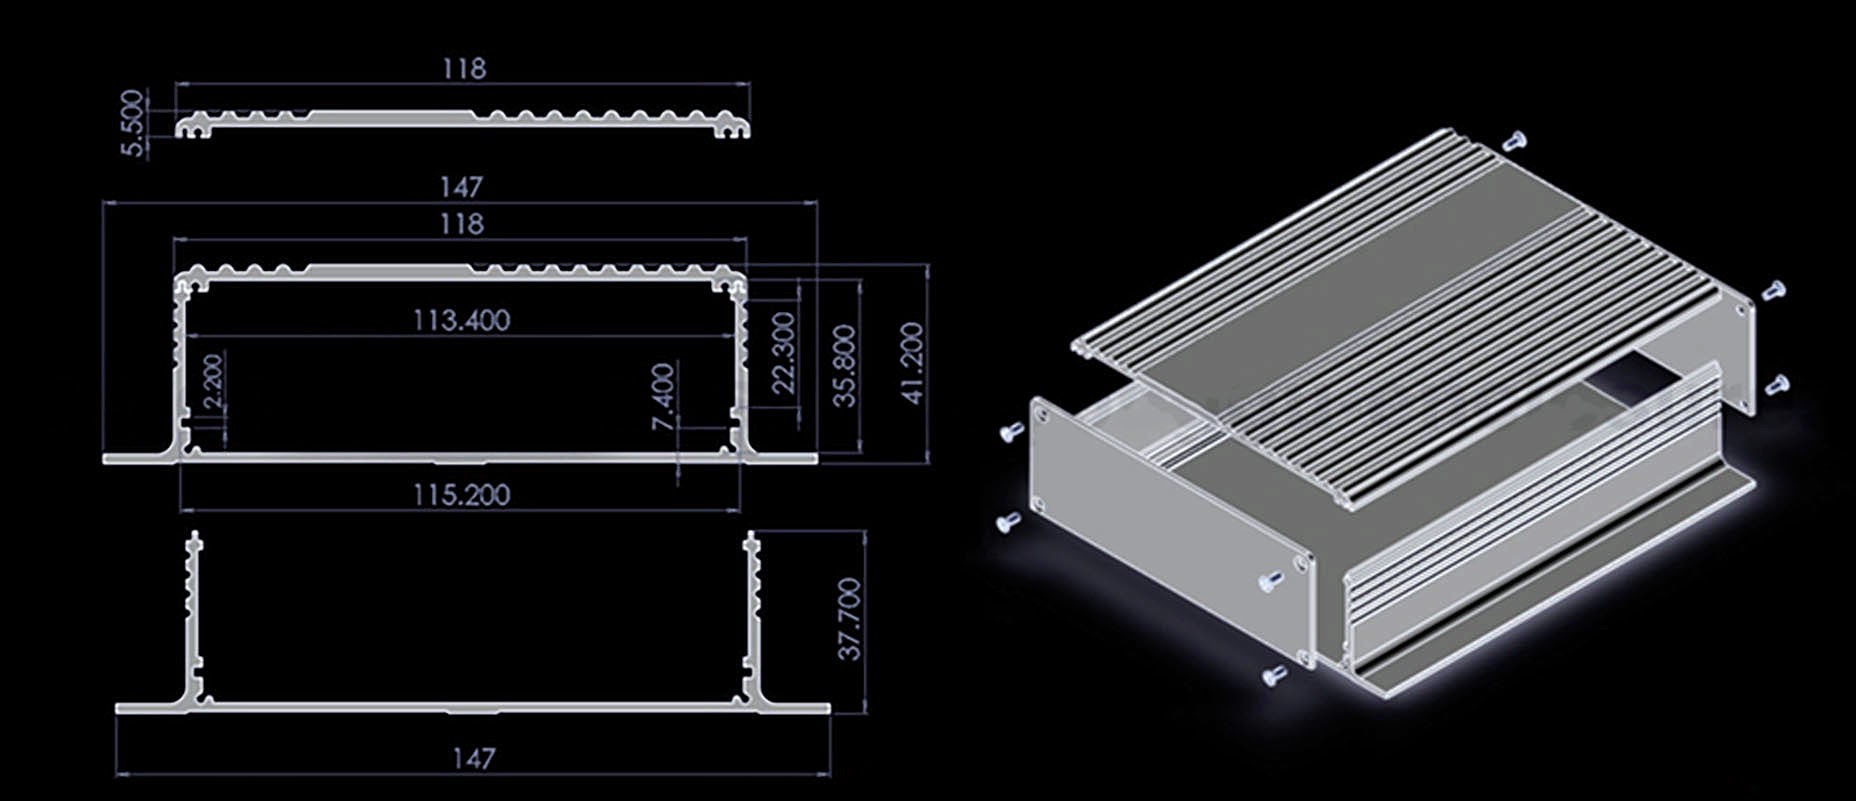
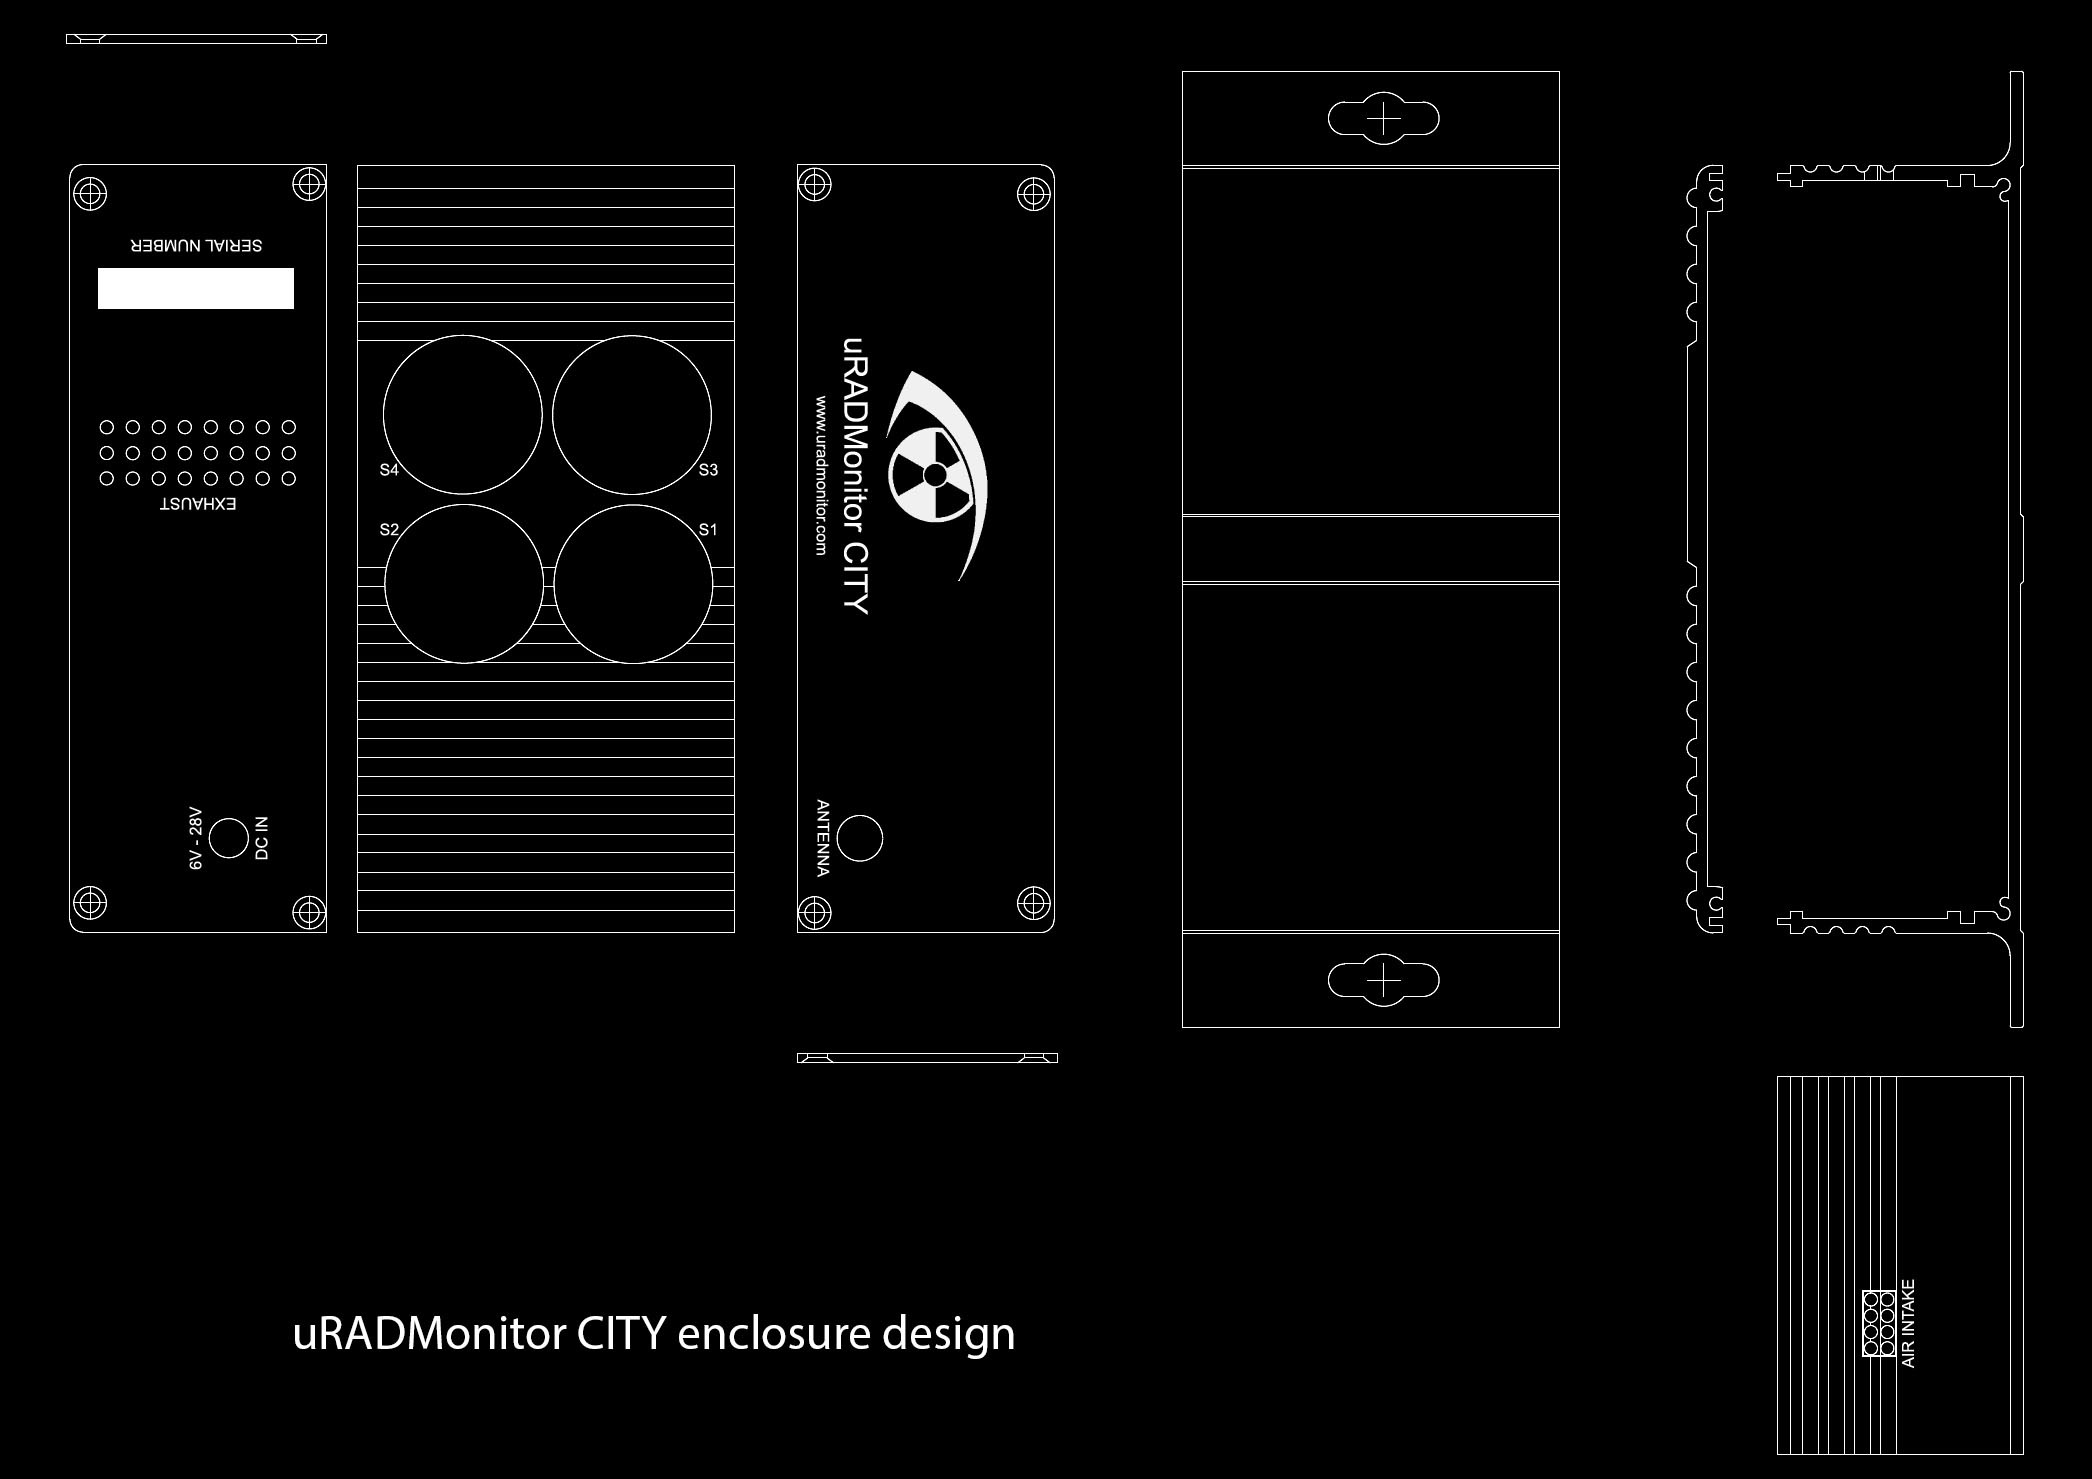
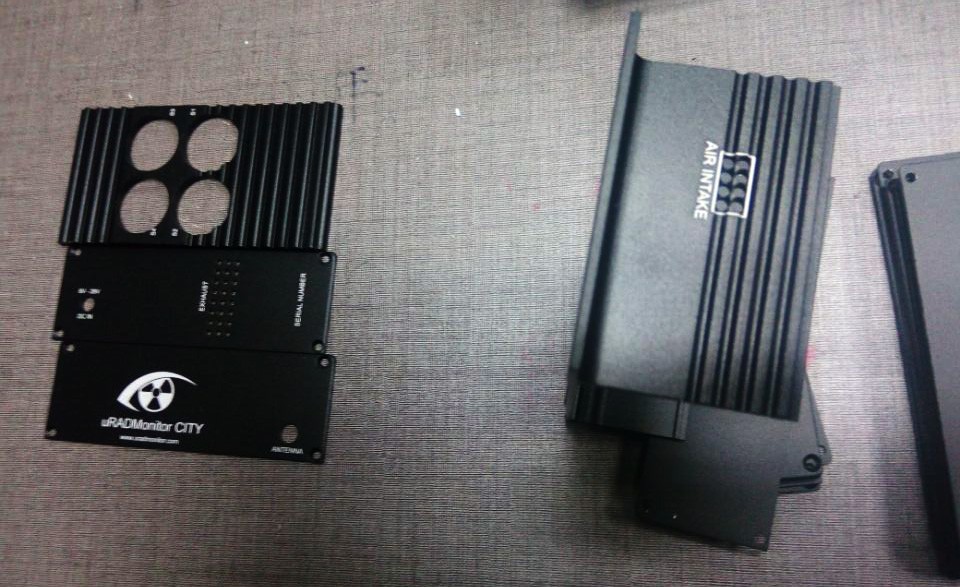
The final product
Here is the final product including the aluminium enclosure I designed, the PCB and the sensors mounted in the sockets:
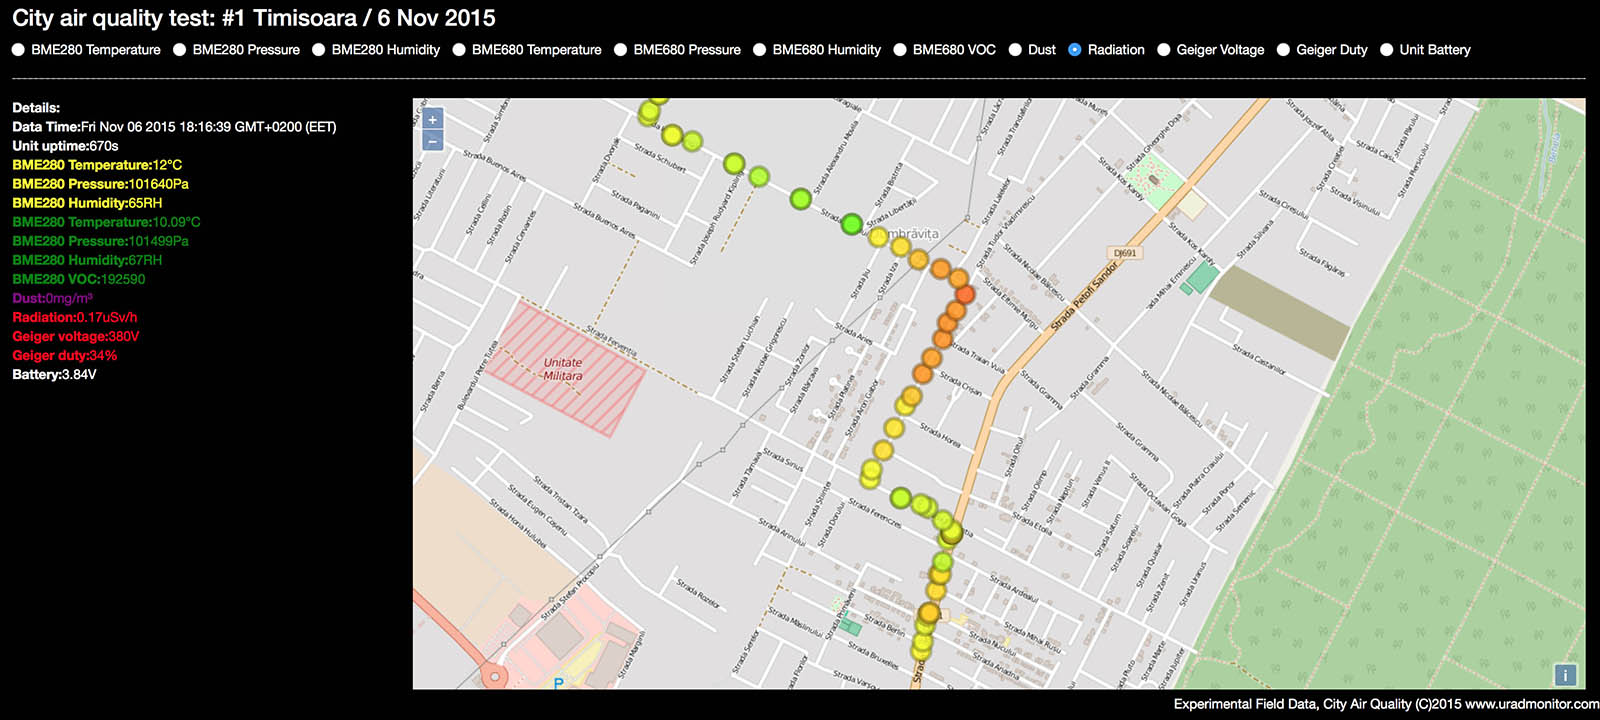
The first prototype
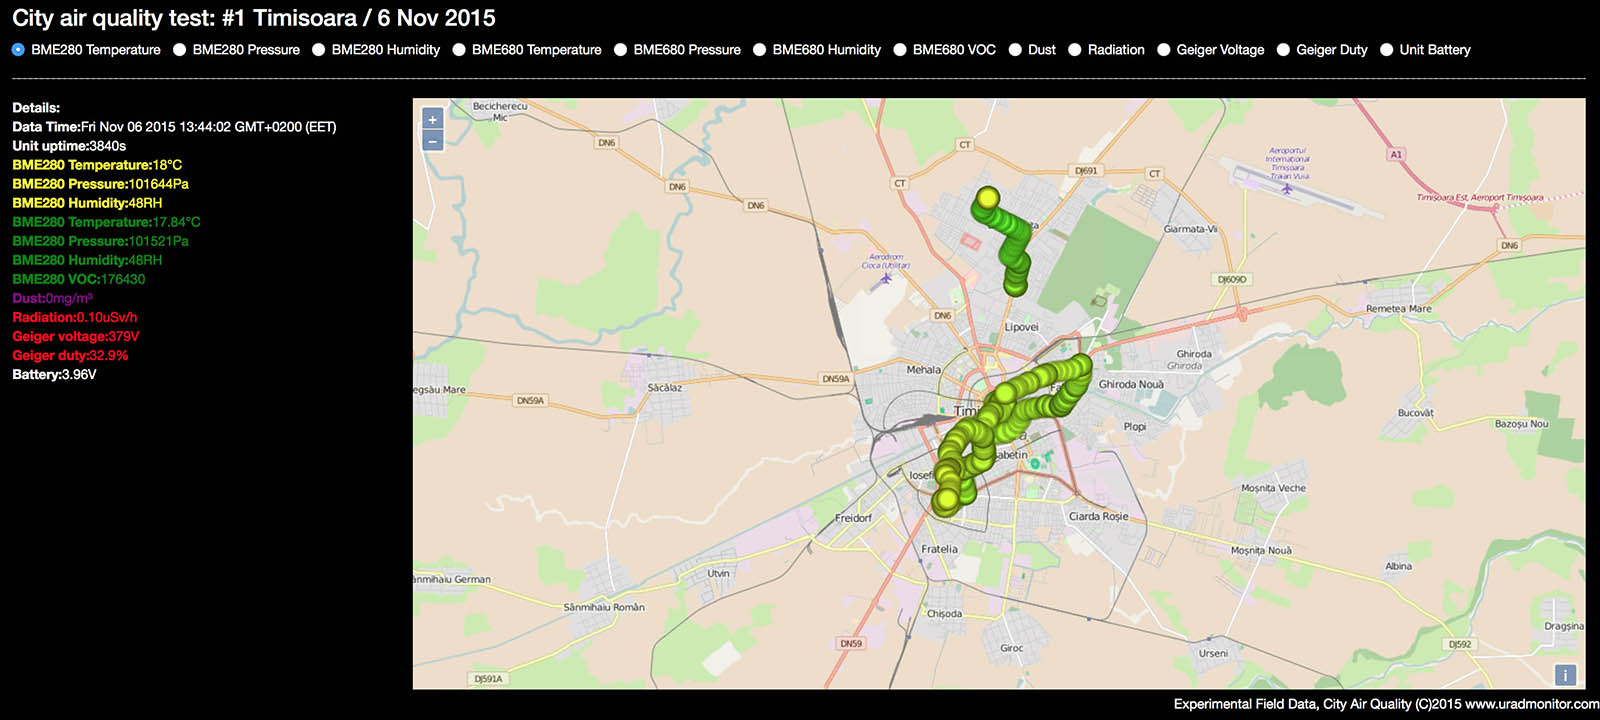
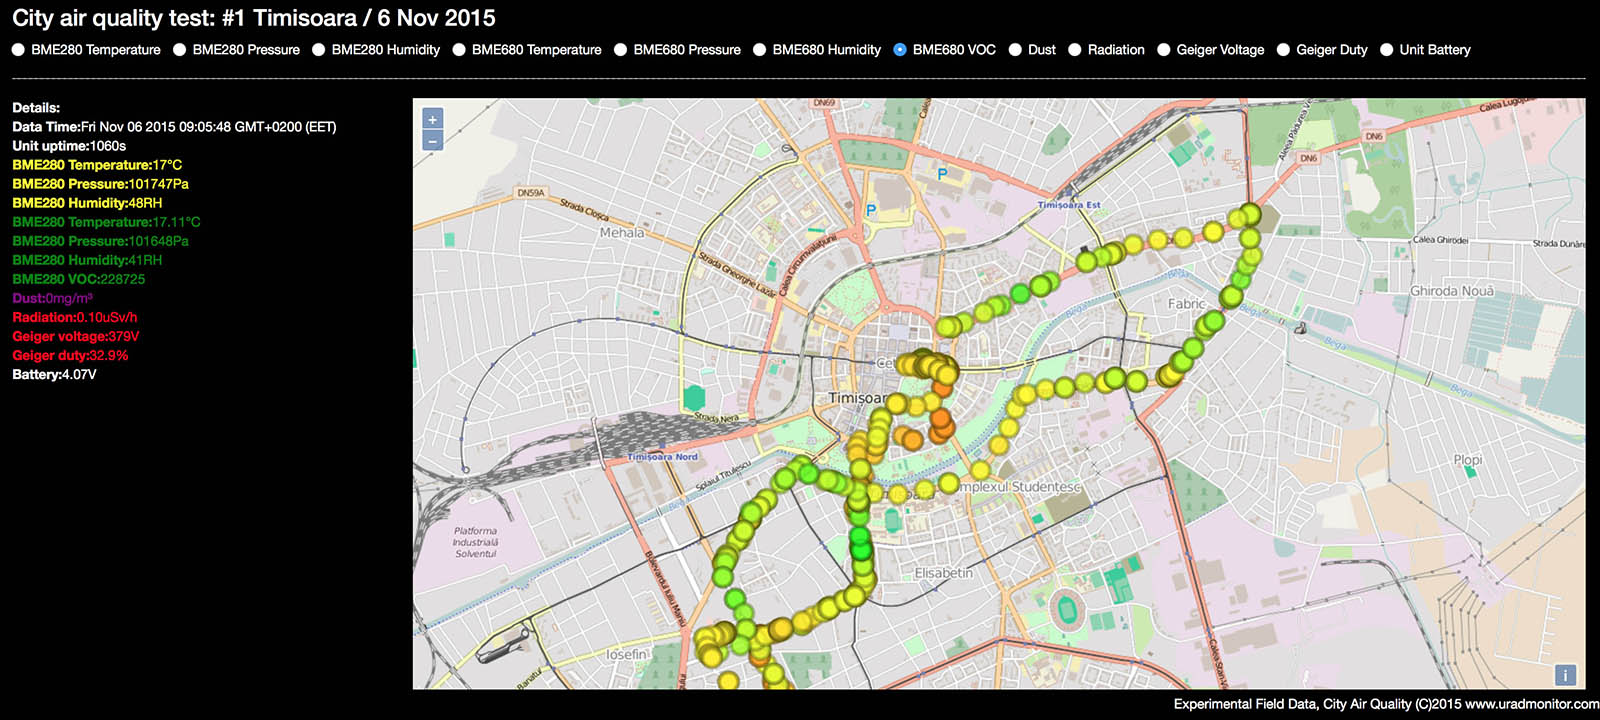
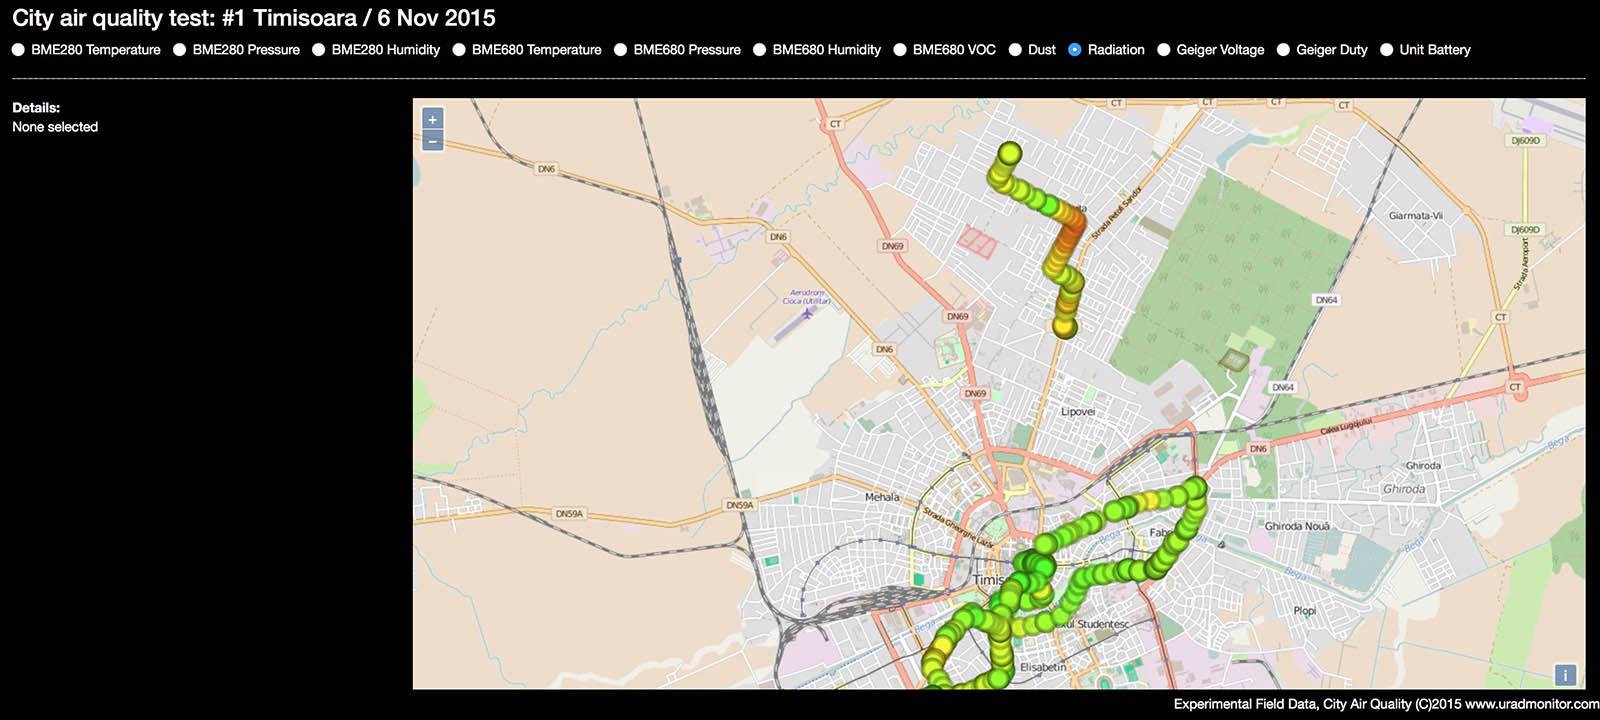
This was a test device, to test sensors in the real environment, collect large amounts of data and see it linked to pollution in various places. The device was installed on a car, thus it was tested on very large distances, gathering relevant data. One such example was my trip to Ciudanovita, presented in one of the project logs.
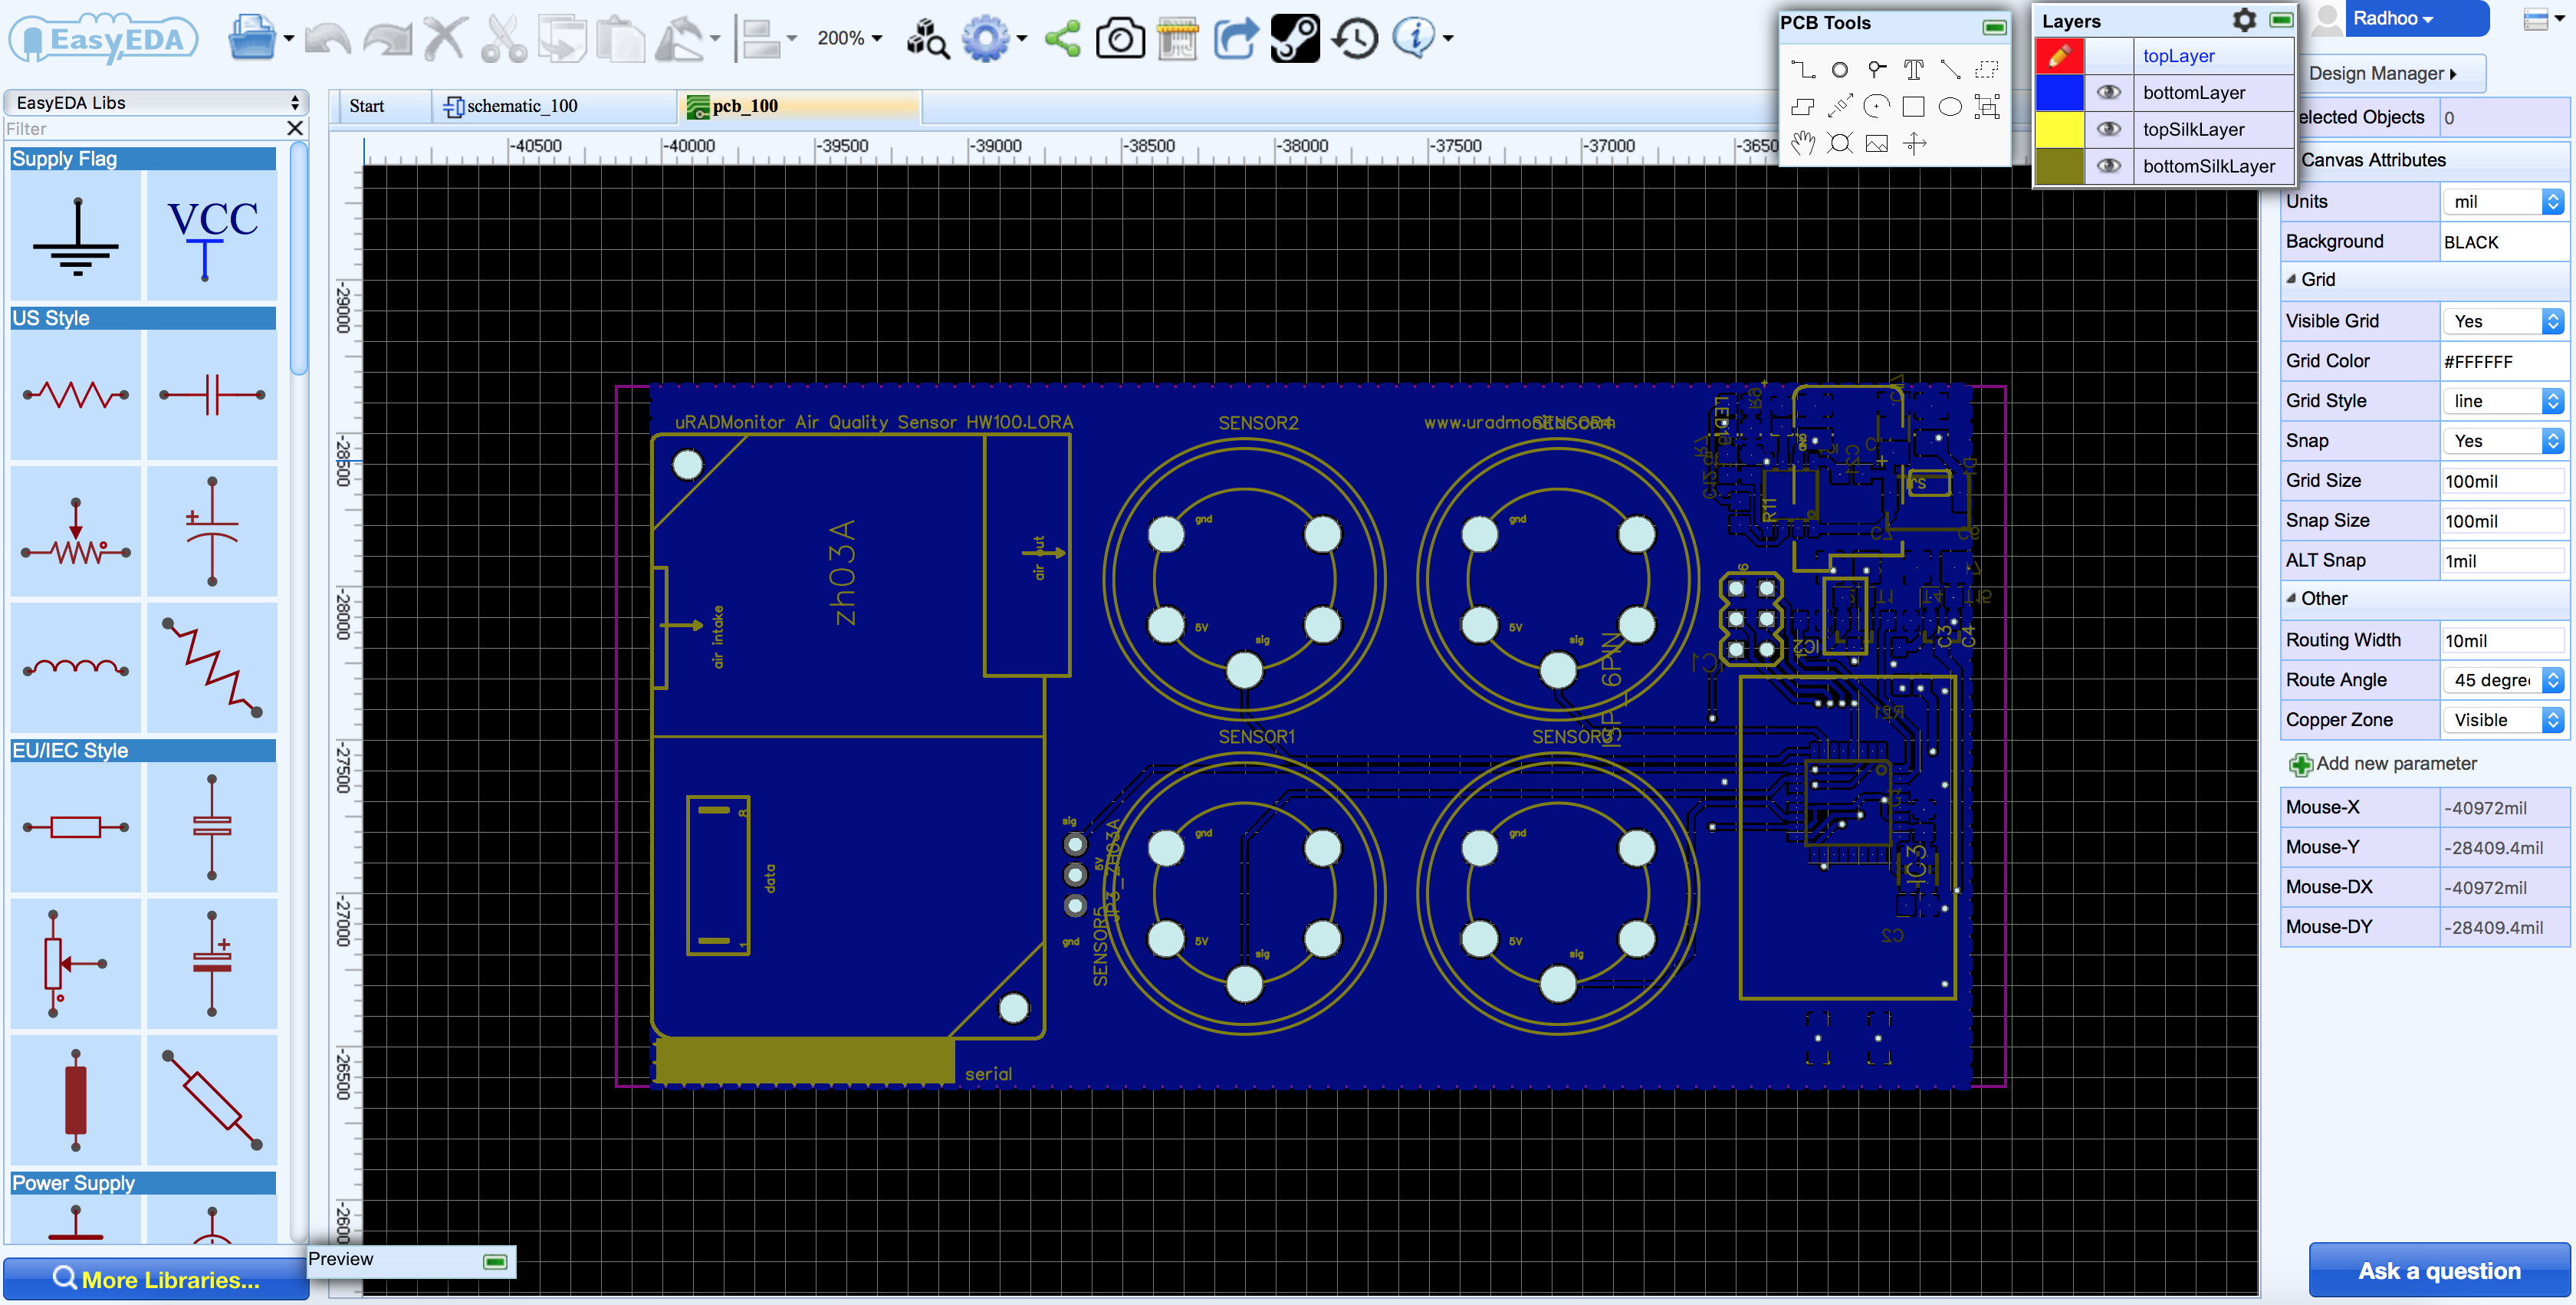
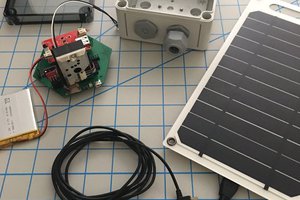
The prototype hardware
The plan is to use a VOC air sensor...
Read more »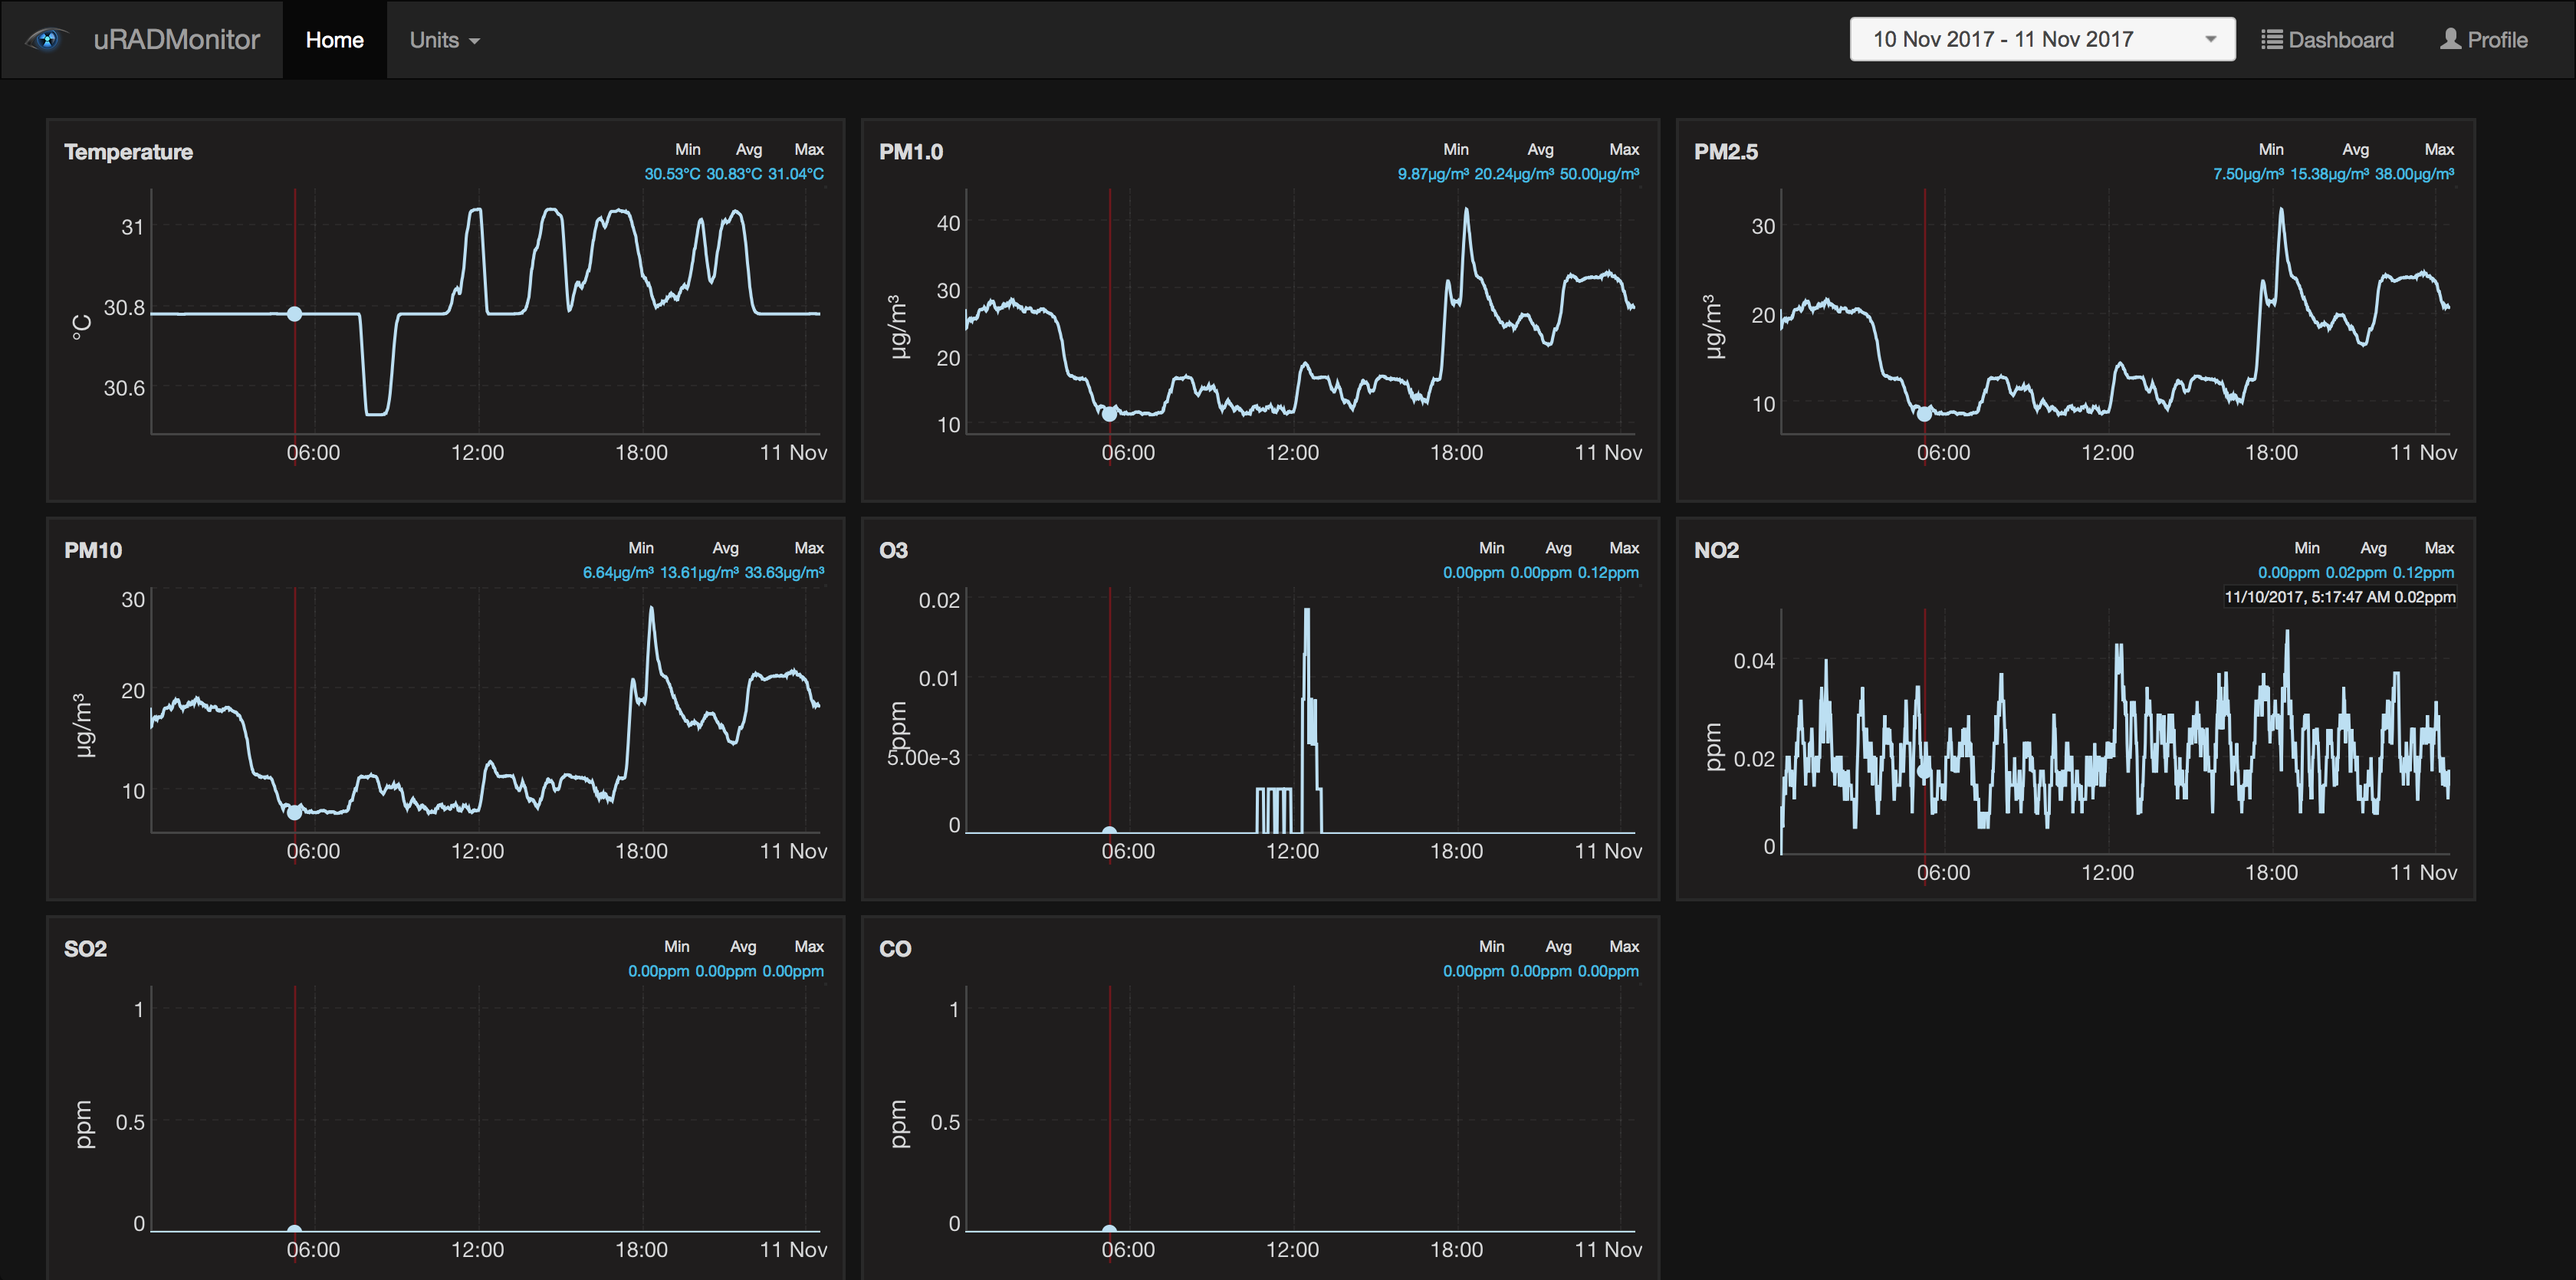


 ACROBOTIC Industries
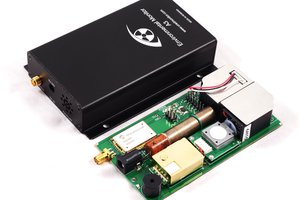

 Manoj kumar
 Supplyframe DesignLab
Very nice project! Can you provide the PCB files for reference?