 johnowhitaker
Seeing images reconstructed from the new, larger ring was pretty cool. But did it offer improvements besides making pretty pictures? In this test, I try to quantify that.
First, some background. With the first ring of sensors I built (8 LEDs, 8 PTs) I used my 3D printer to position an object in 500 random, known locations and take readings for each. I split this data into two sets - one for testing (125 samples) and one for training (375 samples). I train a regression model to predict the location based on the readings. For the 8-sensor ring (r8 from now on), the best model I can make has a mean absolute error (MEA) of 2.3mm, with a root mean squared error (RMSE) of 2.8mm. Shifting to the offset r14 arrangement described in the previous project log, the MEA drops to 1.2mm, RMSE of 1.6. A marked improvement. To put it in plain language, you could place the pen within the ring and have the model tell it's location to within 2 mm most of the time. There are a couple of outliers, but for the most part the model is surprisingly accurate.
I wish I had time for more details, but for now here's the data collection process. Move to location, record data, repeat:
Salient points:
- I used the same 500 positions for the two arrangements
- Moving from 8 to 14 sensors reduced the RMSE of predicted locations by ~40%, not bad!
- For the interested, the machine learning model is a Random Forest regressor from scikit-learn
- Getting the training data is time consuming, even when assisted by a motion platform like a 3D printer. More on this point to follow.
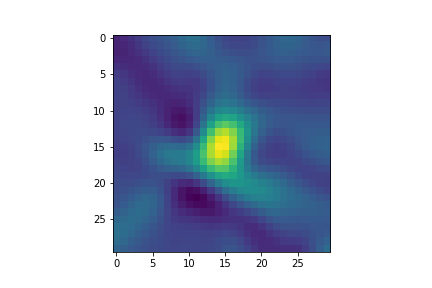
Doing image reconstruction on one set of readings:
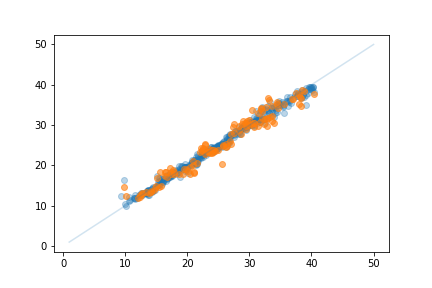
Plotting predicted X location vs actual location for training (blue) and test (orange) data. Not bad!
With this, I can now take a set of readings and predict the location of an object within the ring. Useful? Maybe. Fun? Yes.
Discussions
Become a Hackaday.io Member
Create an account to leave a comment. Already have an account? Log In.