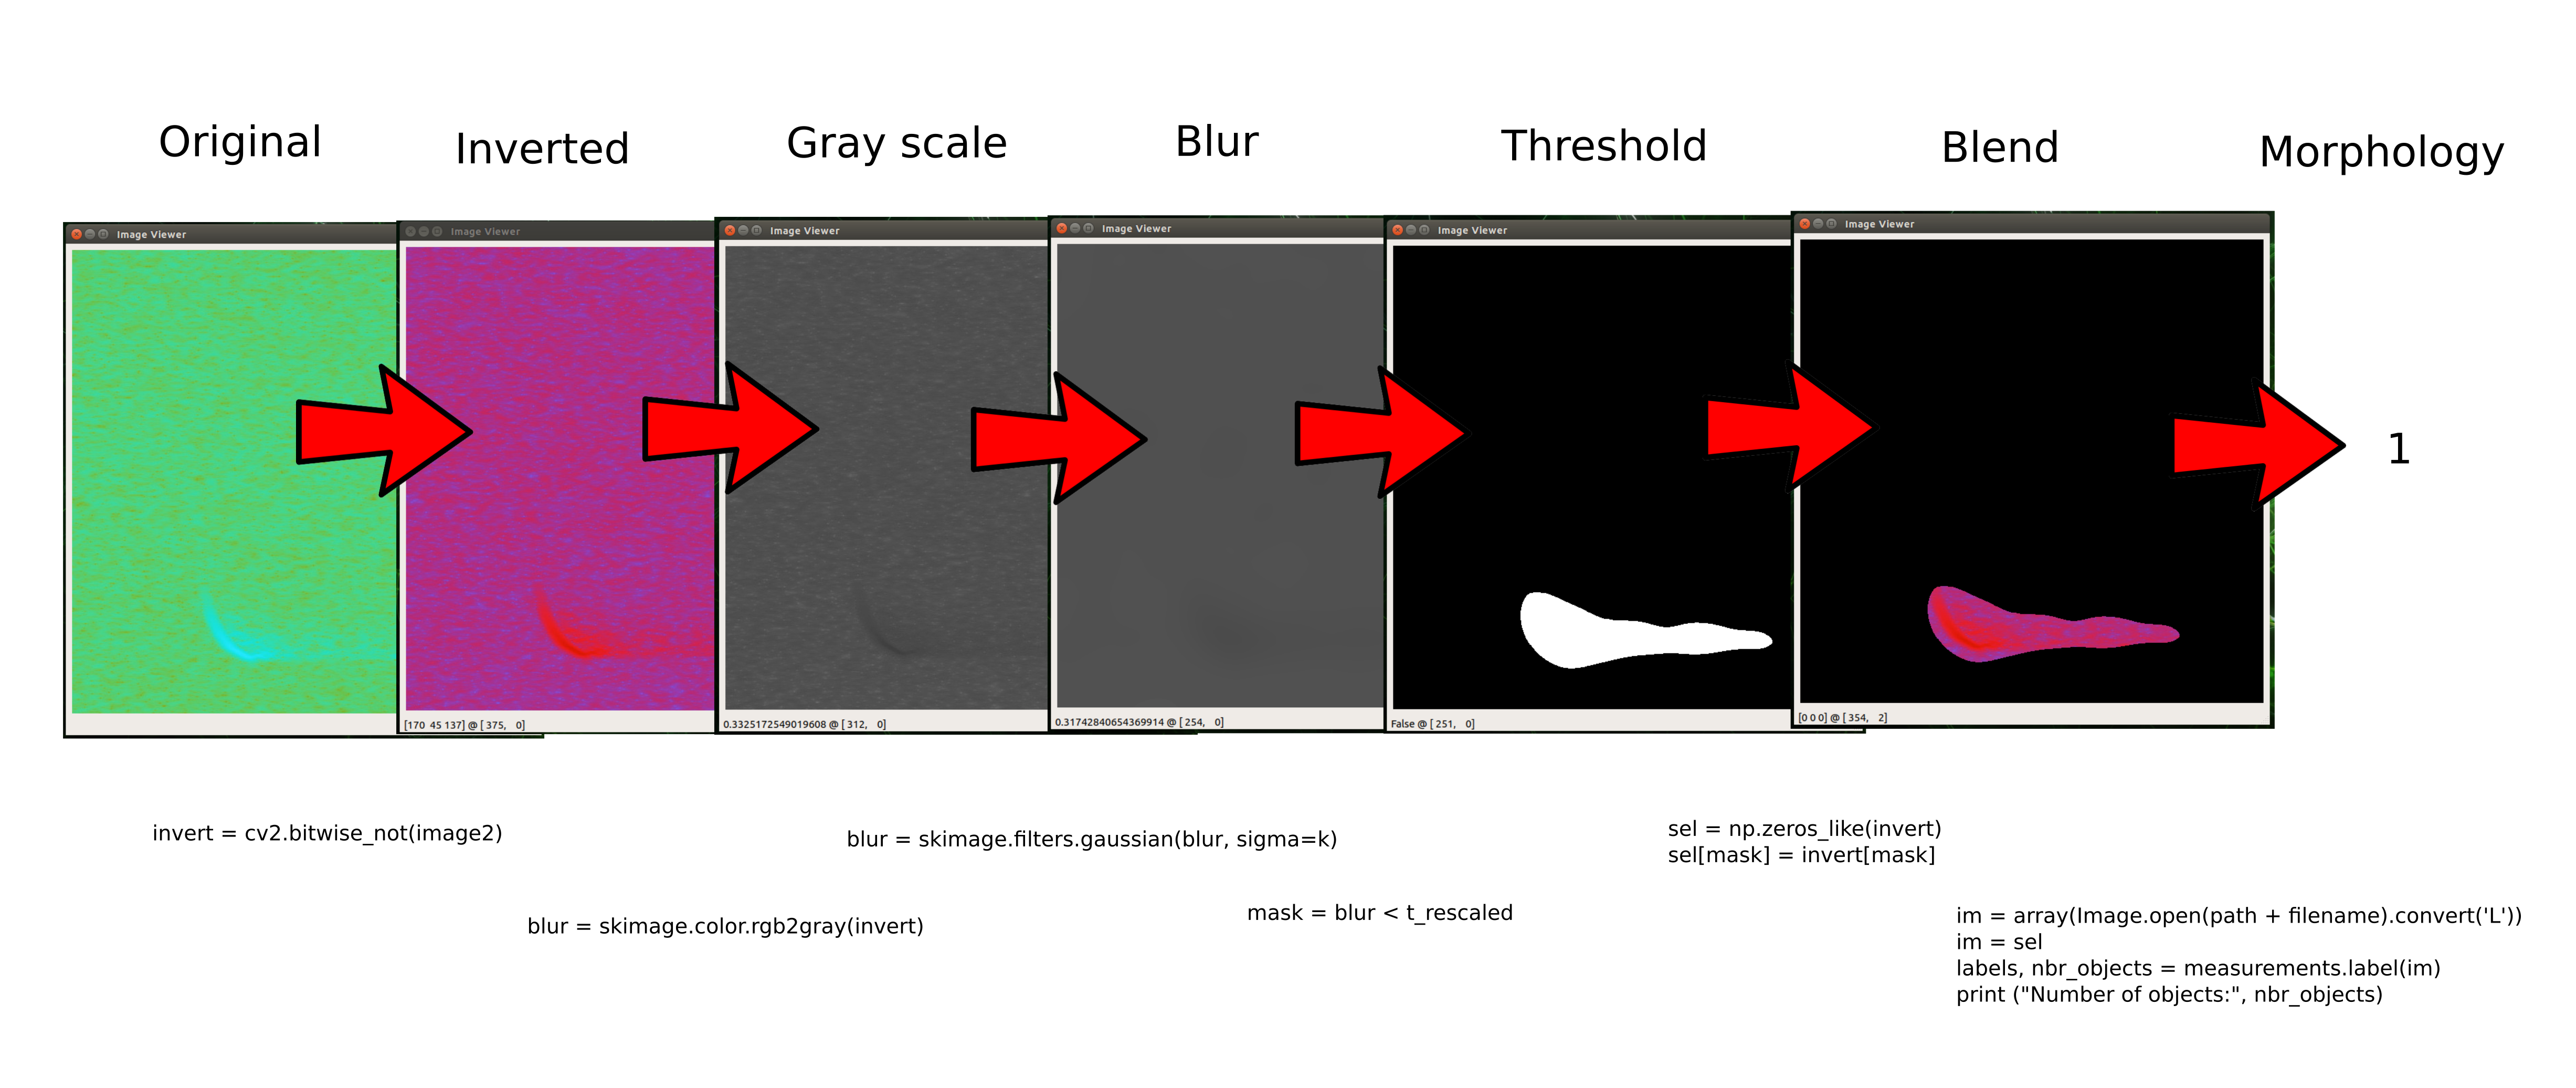
After data augmentation, we get a whole load more spectograph images, but a lot of them are blank so it's a really good idea to auto delete all the blank ones. This is done through a function called 'Morphology', which basically counts discrete shapes in an image. Very useful !!!
The image is firstly inverted, then converted to grey scale, then blurred, then a threshold is applied to create a mask, then blended back with the original and finally, the discrete objects are counted. Anything over 1 is kept and anything of value zero is deleted.
So, about 17,300 spectographs were trainin on the Xavier for about 10 hours. I then fed 177 'unseen' spectographs into the network with the saved model and each result looked pretty much as above. There were 7 false positives, which was expected, and no obvious signs of over fitting.
Although the current software stack can automatically generate thousands of spectographs from almost nothing, each one of them has to be manually checked by eye of human. I tried to train my dog to do this for me, but it just cost me a whole load of German sausage for nothing.
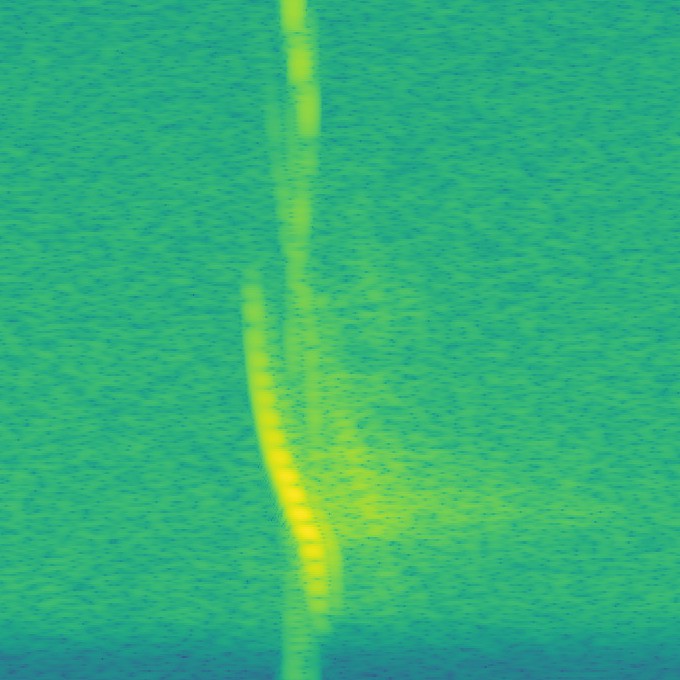
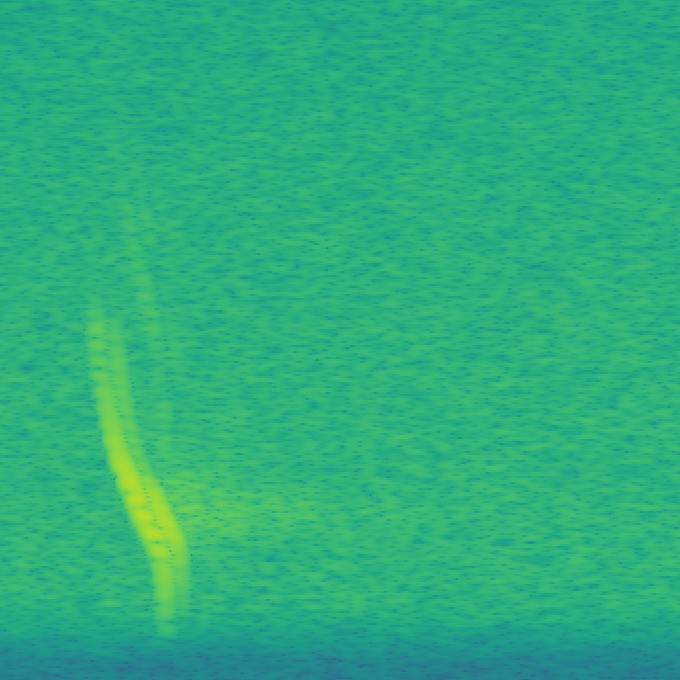
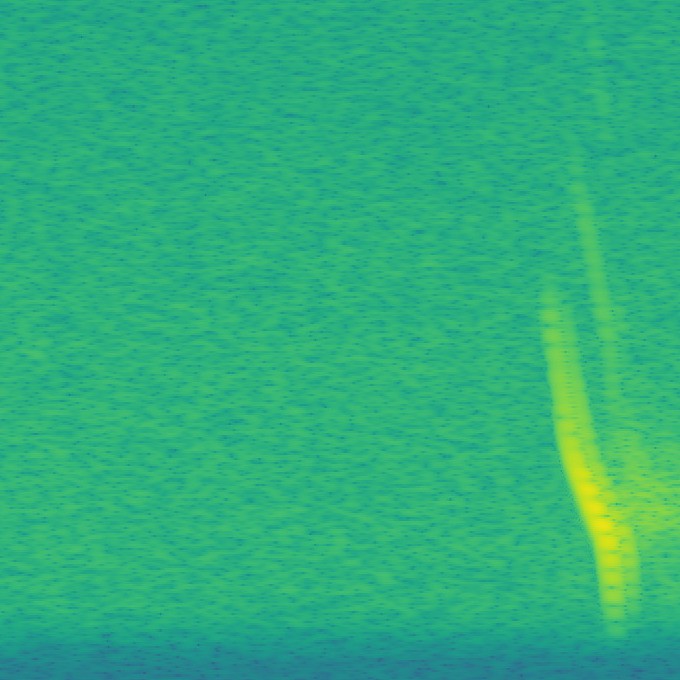
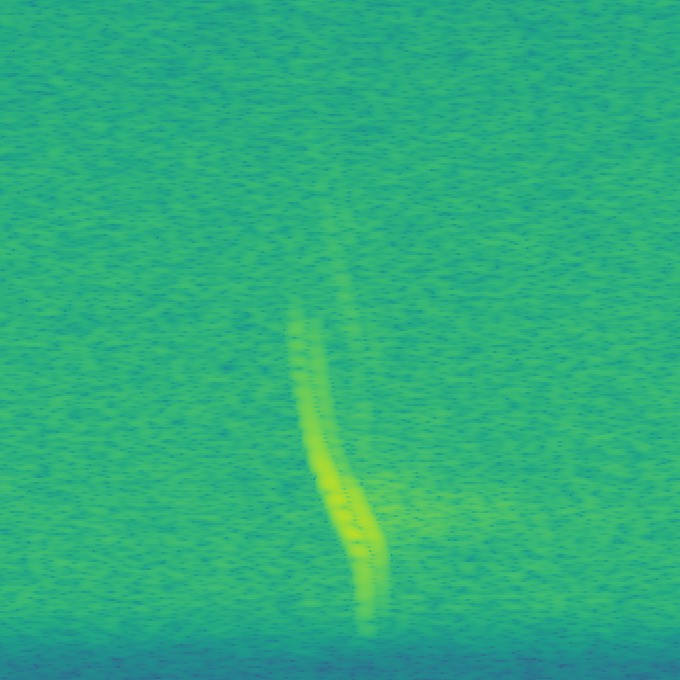
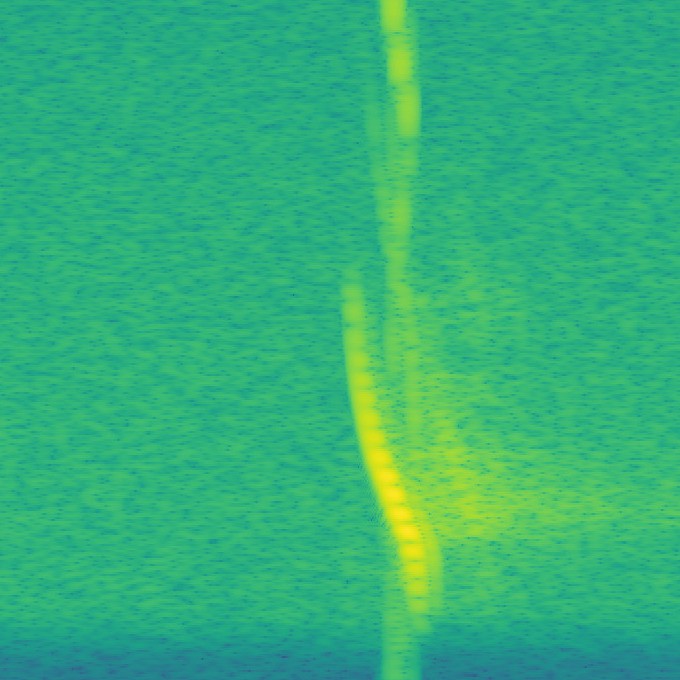
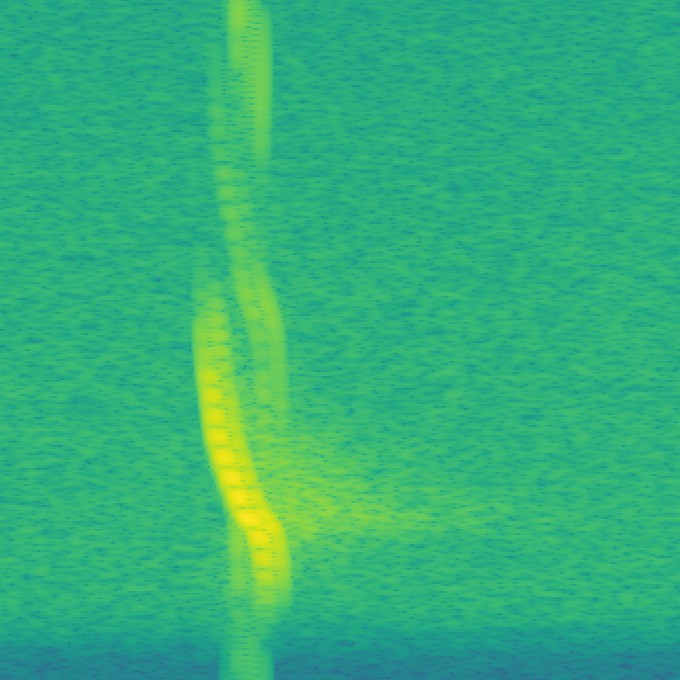
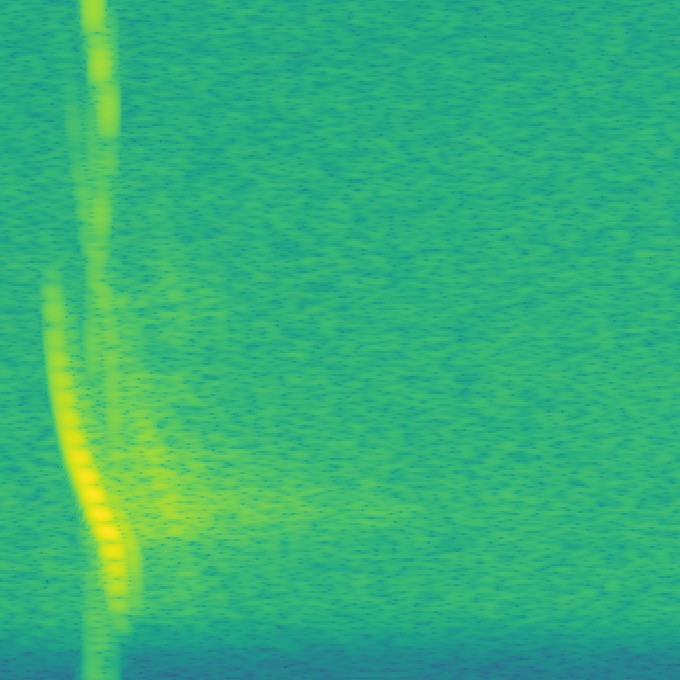
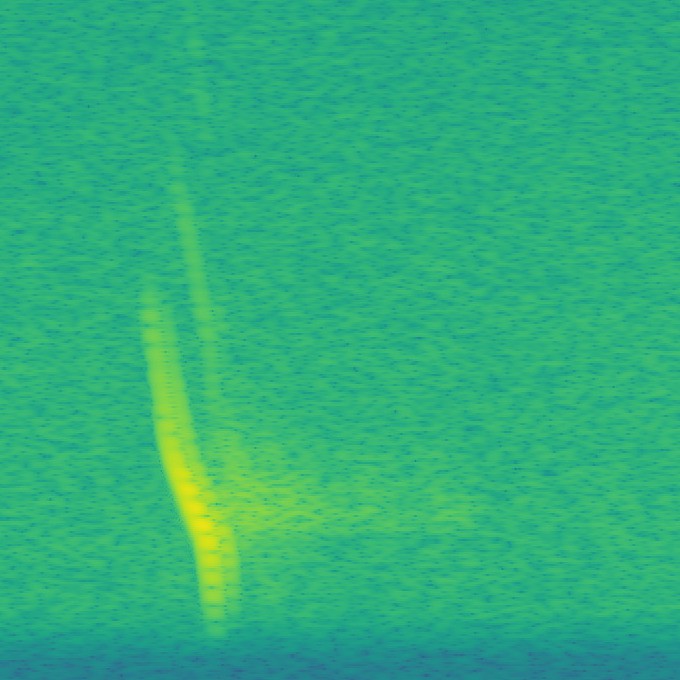
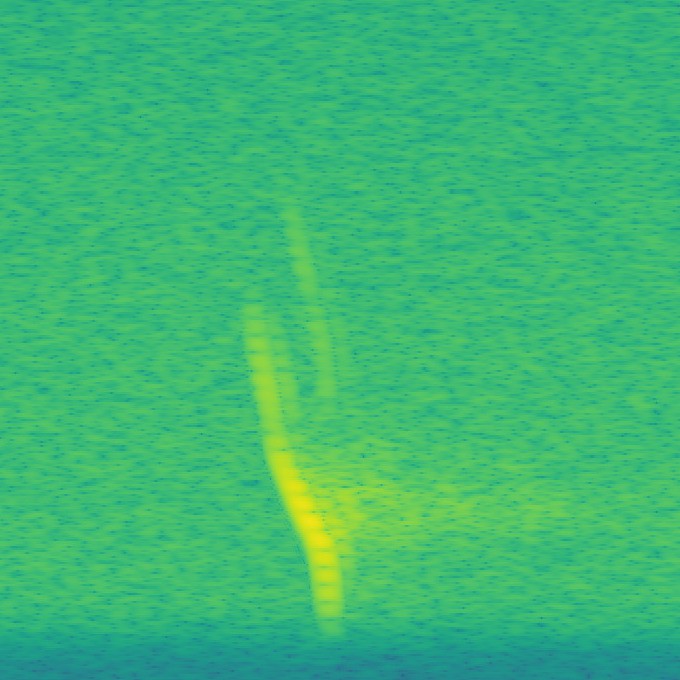
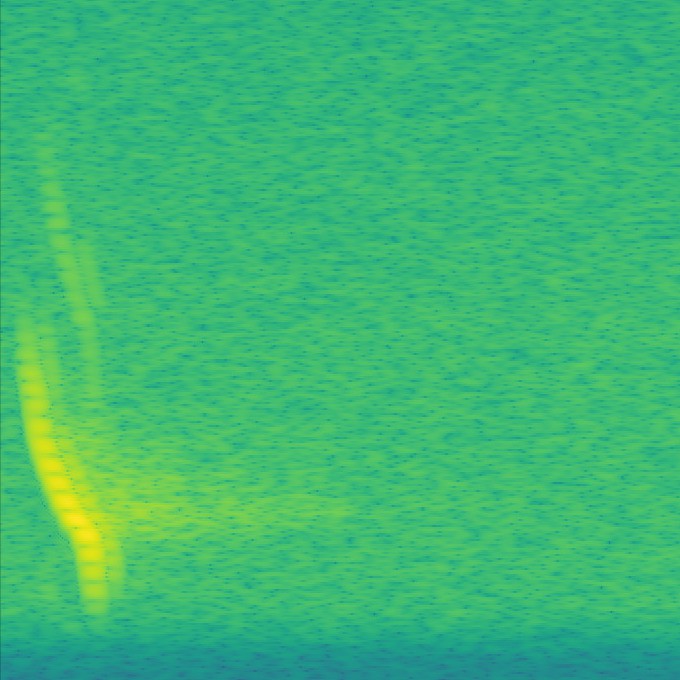
Here's few example of auto generated spectographs for Daubenton's bat ready for training. Each one takes about 0.5 seconds to check by eye:
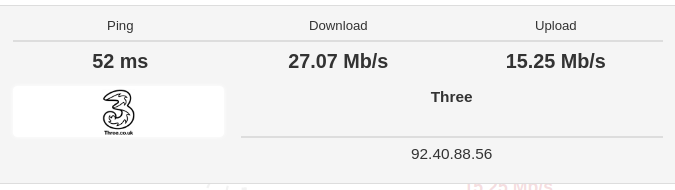
The Sierra Wireless EM7455 is a high end cat 6 4G LTE modem that has a whole load of yummy features such as 300 mb per sec download and 50 mb per sec upload speeds .... Here's the FULL SPEC. In the past I have used some 3G and 2G modems, but only every got them to work in GPRS mode, which is fine for sending lots of text via some rather insecure methods such as 'get' or 'post' but not good for uploading spectograph image files to an Amazon server, for example. Another great feature of this device is that's it's extremely compact and slots nicely into a M.2 key B connector.
The device requires a USB carrier board to connect to the Raspberry Pi or Jetson Nano and there's a few possibilities here although we opted for the Linkwave version and bought a high quality antenna on a 10 metre cable at the same time. Ok, it was expensive, but eventually, the results are worth it as being able to send images quickly means less battery juice being consumed.
Connecting to the Raspberry Pi was just a matter of installing 'network manager' and creating a modem connection with the correct APN settings. For my network Three in the UK, the APN was '3Internet' with no password or username. Simple! Getting functionality with the Jetson Nano was a different matter and required doing a live probe on the system drivers being used in the Raspberry pi using:
tail -f /var/log/syslog
.. run in command line. Eventually i worked out that the most essential driver was qcserial, which is short for 'Qualcomm serial modem', which then had to be enabled in the Jetson Nano kernel .... So with a fresh 128 Gb SD card I flashed the Nano from a host computer using the latest Nvidia SDK Manager package, expanded the file system form 16 Gb to 128 Gb and started messing with the drivers using these these SCRIPTS.
Now to instigate Deep Learning. As opposed to the Random forest method, using a fully convoluted network such as Google's Inception does not require features to be extracted using custom coded algorithms targeted to the animal's echo location voice. The network works it all out on it's own and a good pre-trained model already has a shed load of features defined which can be recycled and applied to new images which are completely unrelated to the old ones. Sounds too good to be true?
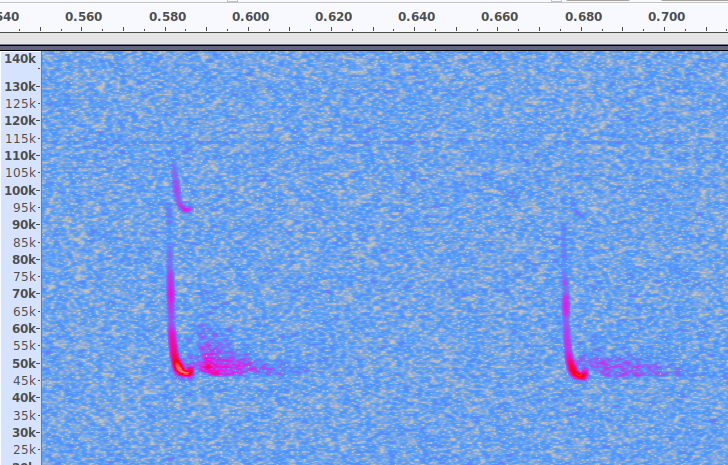
To start with, I was very sceptical about it being able to tell the difference between identical calls at different frequencies, which is important when trying to classify members of the Pipistrelle genus. Basically, calls above 50 KHz are from Soprano Pips and calls under 50 KHz are Common Pips (There are other species in this genus, but not where I live!). So can the network tell the difference? The answer is both yes and no since we are forgetting one major tool at our disposal - data augmentation.
Data augmentation can take many different forms such as flipping the image either horizontally or vertically or both, to give us 4x more data. Great for photos of dogs, but totally inappropriate for bat calls ! (bats never speak in reverse or upside down). Scaling and cropping is also inappropriate as we need to keep the frequency axis in tact. Possibly the only thing we can do is move the main echo-location calls in the time axis ..... so if we have a 20 msec call in a 500 msec audio file we could shift that call sideways in the time frame as much as we wanted. I chose to shift it (about) 64 times with some simple code to create a 'sliding window'. The code uses the Bash 'Mogrify' command which, strangely, only works properly on .jpg images.
Essentially, it involves 8 of these:
# Convert all .png files to .jpg or else mogrify wont work properly:
ls -1 *.png | xargs -n 1 bash -c 'convert "$0" "${0%.png}.jpg"'# delete the .png files:
find . -maxdepth 1 -type f -iname \*.png -delete
# Now split up all the 0.5 second long files into 8 parts of 680 pixels each:for file in *
do
fname="${file%.*}"
mogrify -crop 5500x680+220+340 /media/tegwyn/Xavier_SD/dog-breed-identification/build/plecotus_test_spectographs/test/"$fname".jpg
# This produces image 1 of 8:
cp "$fname".jpg "$fname"_1.jpg
mogrify -crop 680x680+0+0 /media/tegwyn/Xavier_SD/dog-breed-identification/build/plecotus_test_spectographs/test/"$fname"_1.jpg
# This produces image 2 of 8:
cp "$fname".jpg "$fname"_2.jpg
mogrify -crop 680x680+680+0 /media/tegwyn/Xavier_SD/dog-breed-identification/build/plecotus_test_spectographs/test/"$fname"_2.jpg
# This produces image 3 of 8:
cp "$fname".jpg "$fname"_3.jpg
mogrify -crop 680x680+1360+0 /media/tegwyn/Xavier_SD/dog-breed-identification/build/plecotus_test_spectographs/test/"$fname"_3.jpg
# This produces image 4 of 8:
cp "$fname".jpg "$fname"_4.jpg
mogrify -crop 680x680+2040+0 /media/tegwyn/Xavier_SD/dog-breed-identification/build/plecotus_test_spectographs/test/"$fname"_4.jpg
# This produces image 5 of 8:
cp "$fname".jpg "$fname"_5.jpg
mogrify -crop 680x680+2720+0 /media/tegwyn/Xavier_SD/dog-breed-identification/build/plecotus_test_spectographs/test/"$fname"_5.jpg
# This produces image 6 of 8:
cp "$fname".jpg "$fname"_6.jpg
mogrify -crop 680x680+3400+0 /media/tegwyn/Xavier_SD/dog-breed-identification/build/plecotus_test_spectographs/test/"$fname"_6.jpg
# This produces image 7 of 8:
cp "$fname".jpg "$fname"_7.jpg
mogrify -crop 680x680+4080+0 /media/tegwyn/Xavier_SD/dog-breed-identification/build/plecotus_test_spectographs/test/"$fname"_7.jpg
# This produces image 8 of 8:
cp "$fname".jpg "$fname"_8.jpg
mogrify -crop 680x680+4760+0 /media/tegwyn/Xavier_SD/dog-breed-identification/build/plecotus_test_spectographs/test/"$fname"_8.jpg
i=$((i+1))
done
The final code is a bit more complicated than this, but not by much!
Suddenly we've got about 64x the amount of data. But what do the images contain? What if they contain the gaps between calls - ie nothing? .... So now the images needed to be inspected one at a time to make sure that they actually had relevant content .... All 30,000 of them! At a processing rate of about 2 per second, this took about 4 hours. That's 4 hours of sitting in front of a screen pressing the delete and forward arrow. Was it worth it?
I'm not going to go through the process of setting up the software environment for training the Inception classifier using Tensorflow on an Nvidia GPU as most probably, by the time I've finished typing it out, it will have changed. I used to be able to use my Jetson Xavier to train on Nvidia's DetectNet, but guess what? .... Yes, the software dependancies changed slightly and the system won't run without unfathomable critical errors.
Also, it's the age old thing, there's dozens of tutorials for classifying images and 95% of them are incomplete, irrelevant, out of date or simply dont work. After a lot of code skim reading a bit of trial and error, I settled on THIS ONE.
What's great is that the data is really well organised in a very simple manner and the code is well documented and easy to use. Only 2 main files: retrain.py and classify.py. It's supposed to classify dog breeds, but works perfectly on bat spectograms as well!
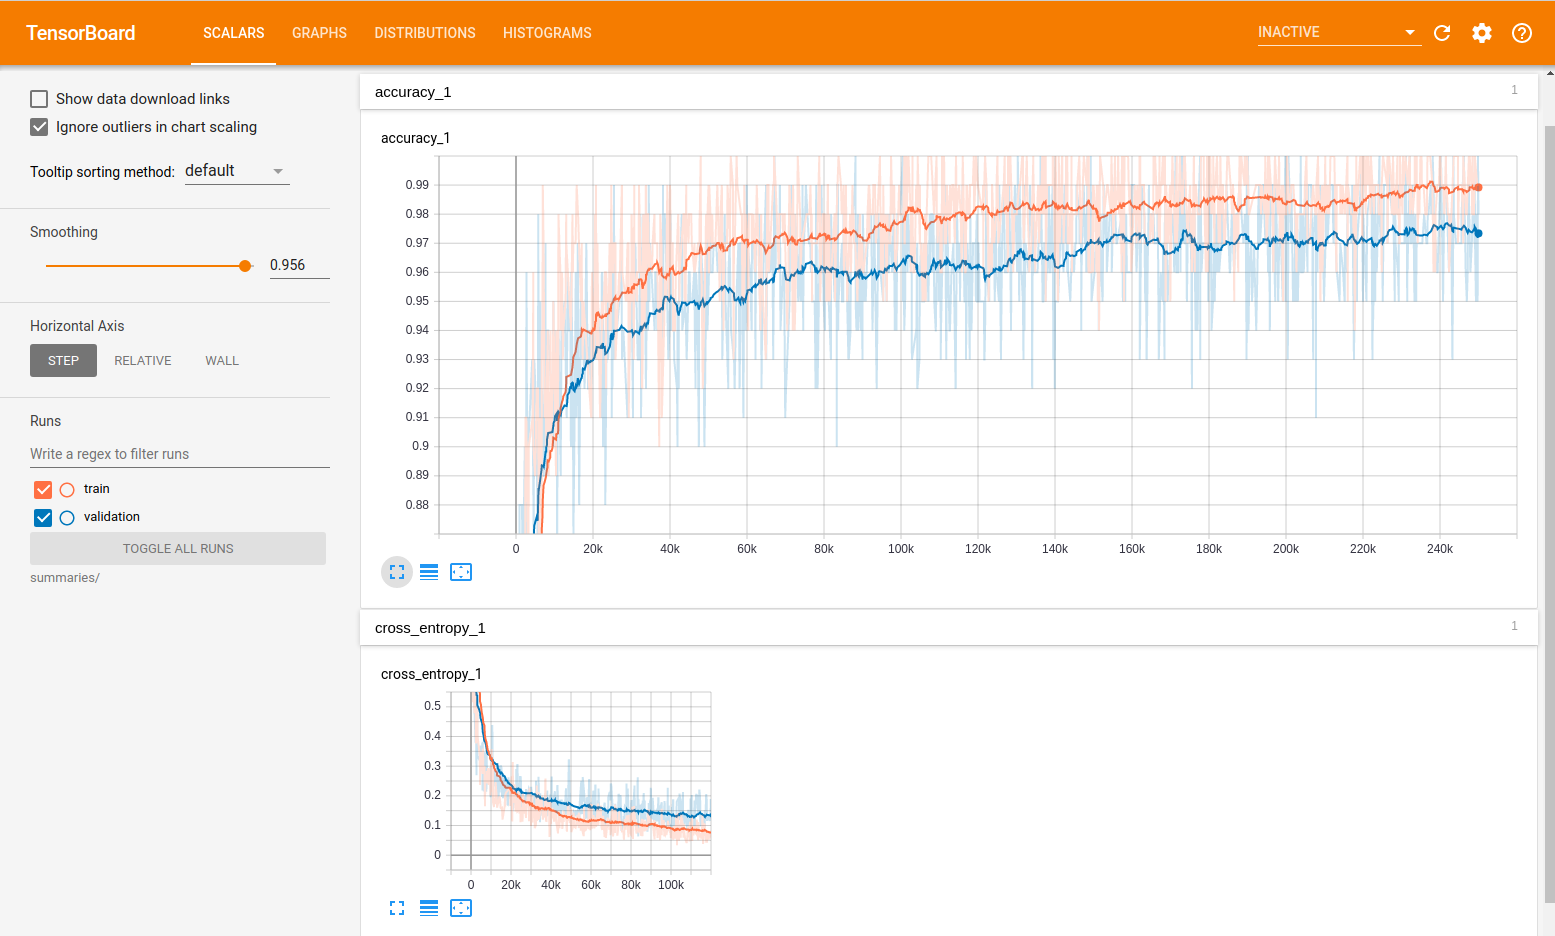
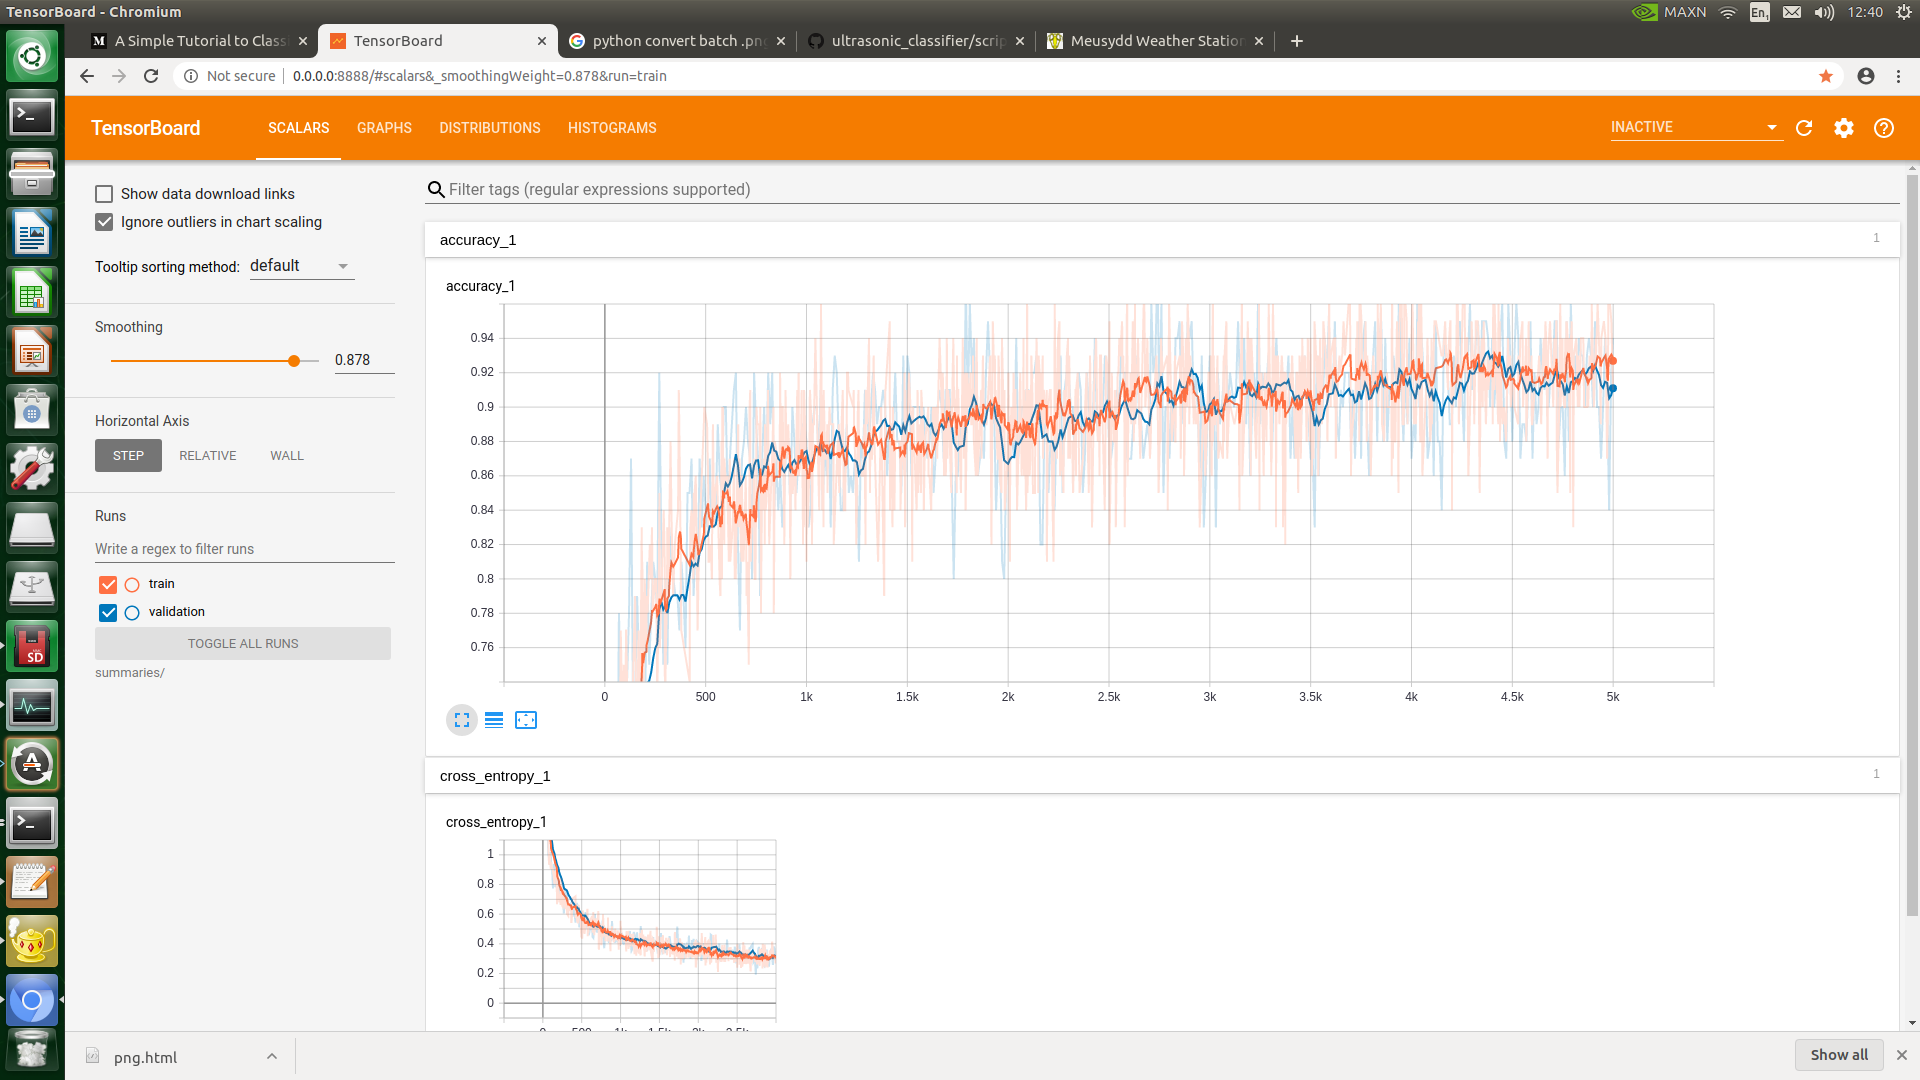
Throw all the species into their own folder, label the folder with the species, chuck the labelled folders into the 'dataset' folder, delete all the dog stuff and run the retrain.py script. Very simple. After training, find the 'retrained_labels.txt' and change the first few lines according to bat species after a few tests. Test the classifier on fresh data by putting it into the 'test' folder and run the classifier.py script. During training, even the Tensorboard function worked:
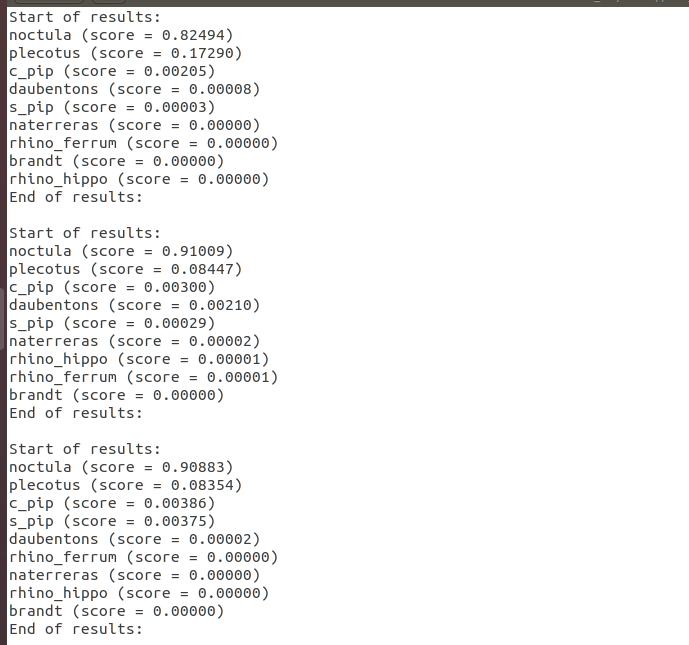
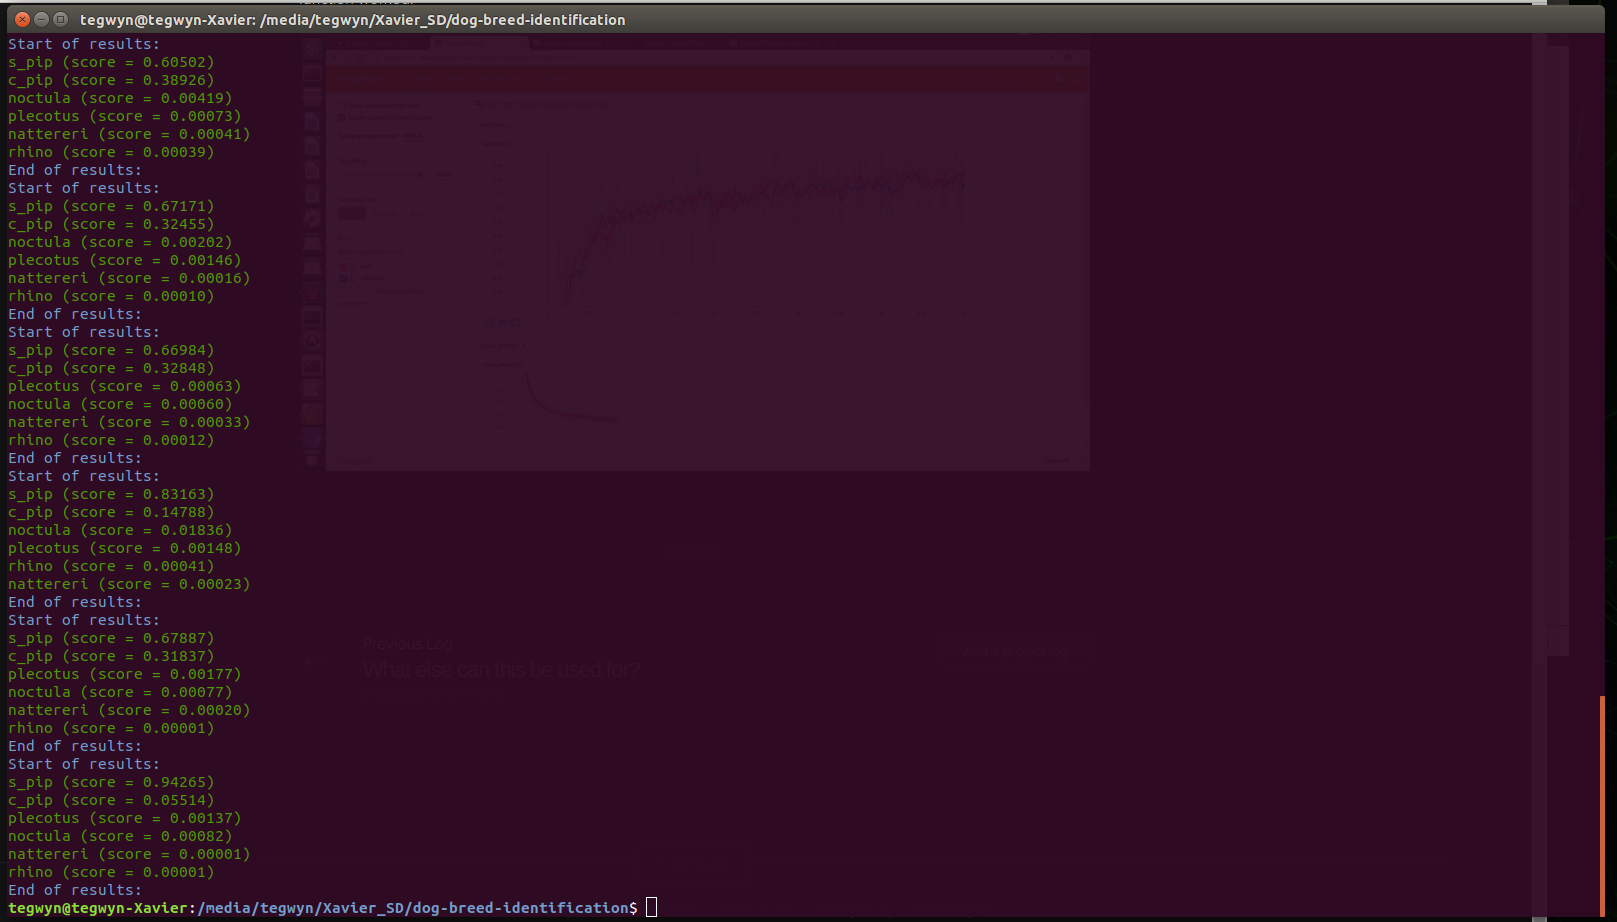
Now test a batch of spectograph images, preferably unseen by the training:
Fortunately, the classifier worked properly on the Pipistrelle species, correctly classifying all the Sopranos as sopranos. What's interesting is that common pips is a close second, and sometimes very close, which is exactly as we would expect. Great - the system is working!
Whilst wildlife is obviously intelligent, an intelligent wildlife detector uses so called artificial intelligence to analyse audio recordings and calculate probabilities that a certain species was roaming around in the near vicinity. Most importantly, the software is open source so it can be adjusted to work in any geographical area on different levels. For example, here in the UK, the system is set up to detect my local bat species and I can also select genus or even just animal, in which case it will give results according to whether the audio was of a bat, a rodent or a cricket.
Obviously not everybody is going to have the skills to hack the software, but to someone who does have the skills, it's actually not that hard to train the system to work on, for example, the local birds in the area. The hard part is actually getting all the recordings and sorting them into the different species.
So, assuming the software is now tuned on the local animals / birds, the device would now be deployed out in the wild to seamlessly record chunks of audio and analyse each one of them on the spot to try and find something interesting. If the system finds something, even just a snapping twig, it will save the audio file, renaming it to 'rubbish' or such like. If it finds nothing, it will delete the file, saving space on the file storage device. More to the point, if it finds an interesting animal it will rename the file with the confidence of successful classification and the animal name and the date. Eg 95%_Nattereri_02:07:2020_18:44.wav. This saves a huge amount of time manually sorting through hundreds of Gb of data and manually naming files.
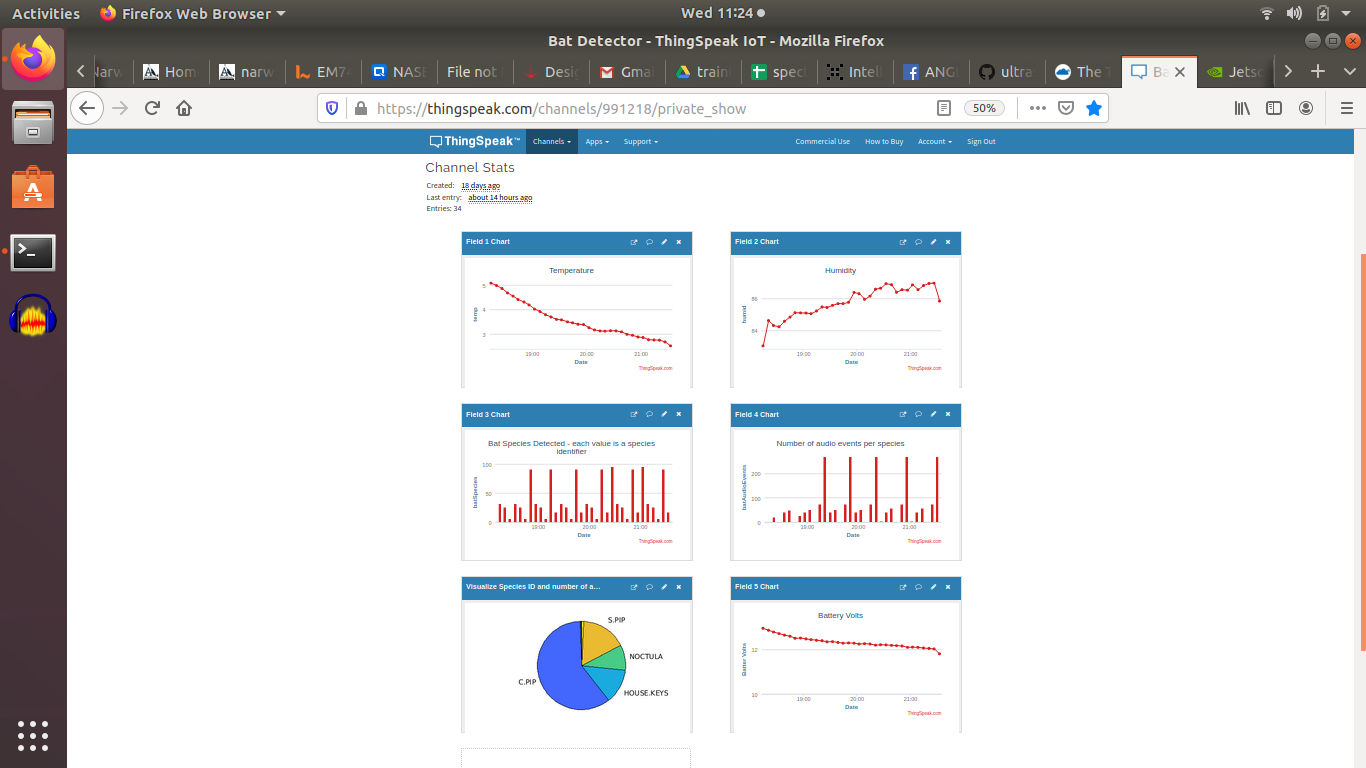
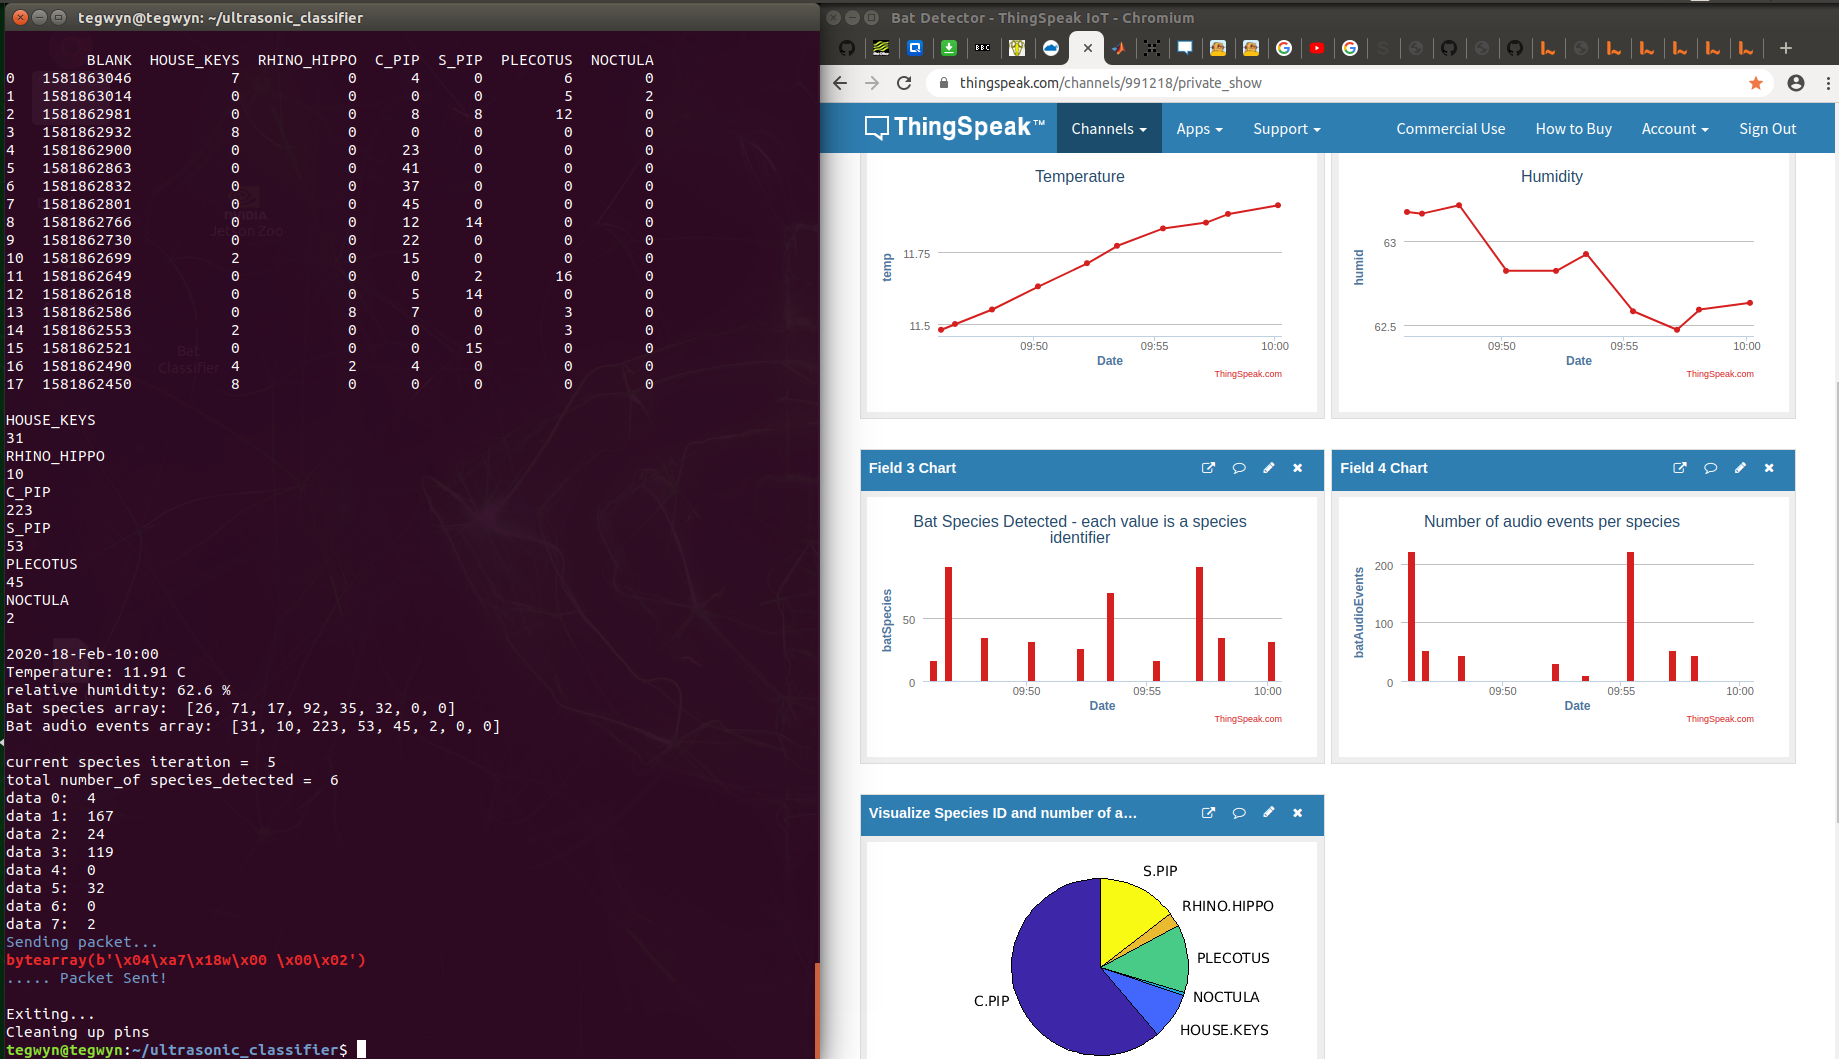
The device itself has a lot of other functions, including displaying the data in a dynamic bar-chart on a small touchscreen. There's also the capability to transmit some of the data to the cloud via a radio link or the 4G cell phone network although much of our wildlife has the tendency to inhabit rather remote locations, far away from human communication infrastructure. For example, connection to the cloud is not going to work in the middle of the Amazon rain forest without a more expensive satellite transmitter.
It is possible to leave the device out in the wilderness for a long period of time but it would need an external battery and solar panel to keep it alive. It would also need to be hidden and protected from theft or tampering, whether that be from human beings or other curious wildlife.
LoRa is not meant for big data. To get long range transmission with low power, the transmit time can be quite long, about a second in this case, and the TTN has a fair use policy of 30 seconds per day. For developers, this is a challenge and creating a simple bar chart as above is no easy feat. The data I wanted to transmit is represented in the table, top left, so obviously trying to transmit this in one go is a non starter. Instead, I transmitted one species at a time, presuming that normally we would not have more than 2 or 3 species being detected in one evening. This worked quite well except, as can be seen in the middle right, there are gaps in the data! This was solved by iterating through the species repeatedly and programming the channel to give precedence to the most recent reading for that species. After familiar with MatLab, this was actually quite fun and eventually I came up with quite a neat bit of code:
% Channel ID to read data from
readChannelID = 744655;
SpeciesIDFieldID = 3;
AudioEventsFieldID = 4;
% Channel Read API Key % If your channel is private, then enter the read API % Key between the '' below:
readAPIKey = '';
% Fetch the last 10 points from the Bat Detector channel:
speciesID= thingSpeakRead(readChannelID,'Fields',SpeciesIDFieldID,'NumPoints',10,...
'ReadKey',readAPIKey);
numAudioEvents = thingSpeakRead(readChannelID,'Fields',AudioEventsFieldID,...
'NumPoints',10,'ReadKey',readAPIKey);
A = [speciesID numAudioEvents]
[~,b] = unique(A(:,1),'last')
C = A(b,:)
% Extract the first column, species label:
D = C(:,1)
% Extract the second column, audio events:
E = C(:,2)
labels = string(D)
x = E
% This is where the mapping assignment occurs:% May want to remove House keys or try and divide by 10 or something.
numbers_to_decode = {'0','17','26','32','35','71','92'};
names = {'','C.PIP','HOUSE.KEYS','NOCTULA','PLECOTUS','RHINO.HIPPO','S.PIP'};
M = containers.Map(numbers_to_decode,names)
k = keys(M) ;
val = values(M) ;
% Now get the species name from the numbers using the map:
for i = 1:length(labels)
z{i}=M(labels{i})
end
% Trim the length of the audio events vector to fit that of species:
len_z = length(z);
len_x = length(x);
len_xy = (len_x - len_z);
% Trim x vector to match z:
x = x(len_xy +1 : end);
pie(x,z)
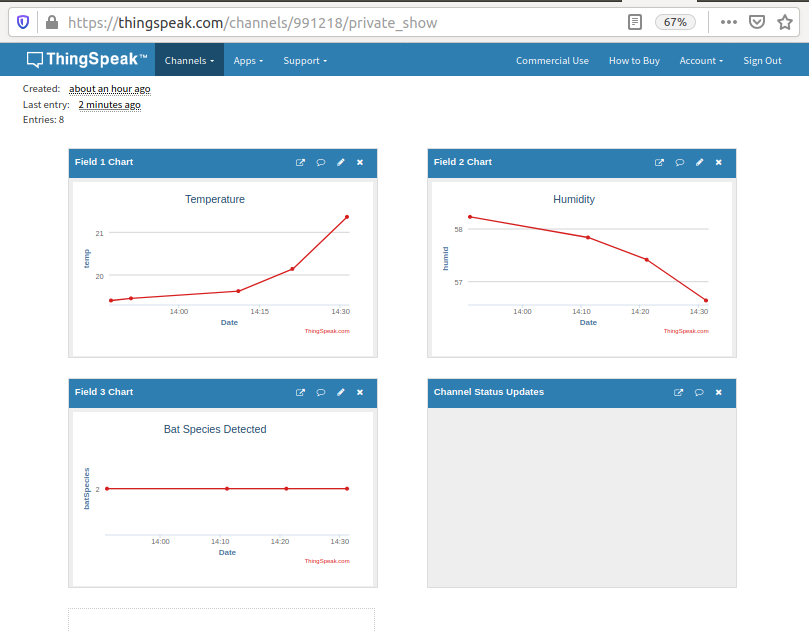
This was typed into the 'visualisations' sections and tested by hitting the 'save and run' button.
I can't stress how incredibly user friendly ThingSpeak is and they give quite a generous 3 million data points and 4 channels before it's necessary to buy a license.
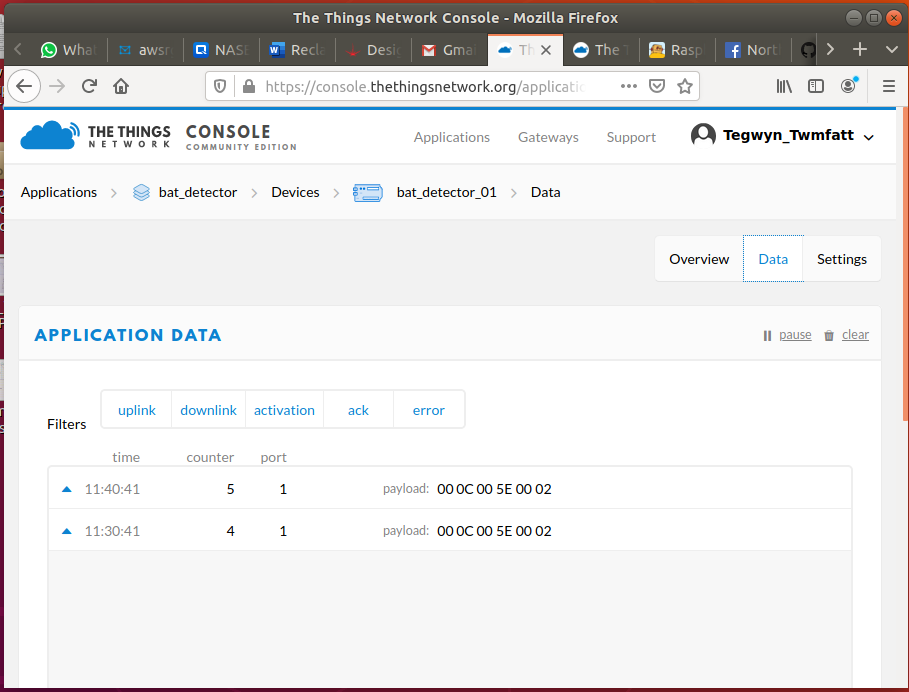
Following the Adafruit tutorial to connect to The Things Network (TTN). This will get data through a local gateway if one is in range, but will not store the data or produce fancy graphs:
First step accomplished: Get data to the TTN!
Next, create a Payload Format:
functionDecoder(bytes, port){
// Decode an uplink message from a buffer// (array) of bytes to an object of fields.var decoded = {};
//if (port === 1) decoded.temp = (bytes[1] + bytes[0] * 256)/100;
if (port === 1) decoded.field1 = (bytes[1] + bytes[0] * 256)/100;
//if (port === 1) decoded.humid = (bytes[3] + bytes[2] * 256)/100;
if (port === 1) decoded.field2 = (bytes[3] + bytes[2] * 256)/100;
//if (port === 1) decoded.batSpecies = (bytes[5] + bytes[4] * 256);
if (port === 1) decoded.field3 = (bytes[5] + bytes[4] * 256);
return decoded;
}
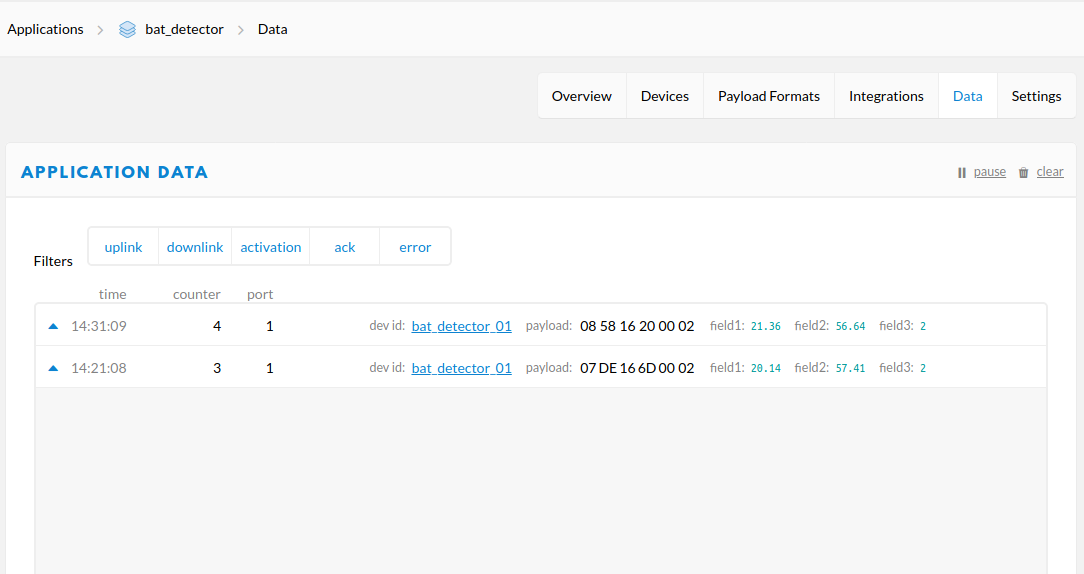
The data stream will now look like this:
Register with ThingSpeak and find 'Create new Channel' to process the data. Their instructions are very good and it's dead easy!
Go back to TTN and find the 'Integrations' tab and add ThingSpeak with the appropriate channel ID and write API key from the new ThingSpeak channnel.
 Capt. Flatus O'Flaherty ☠