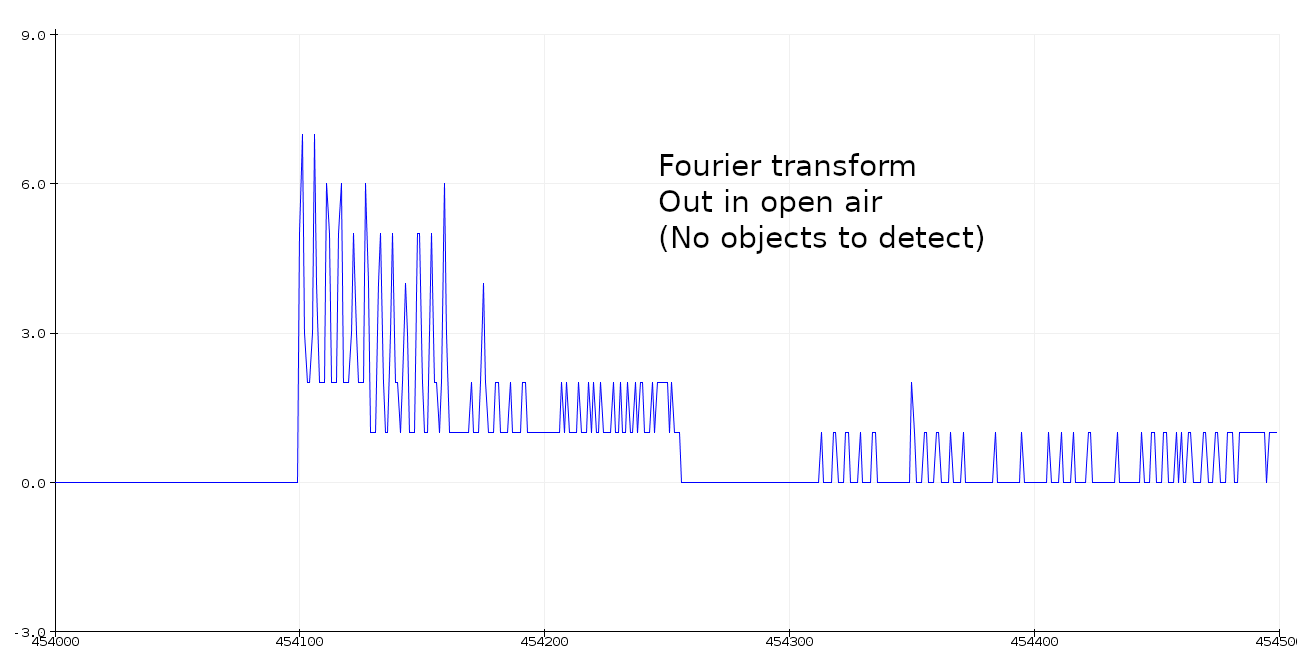
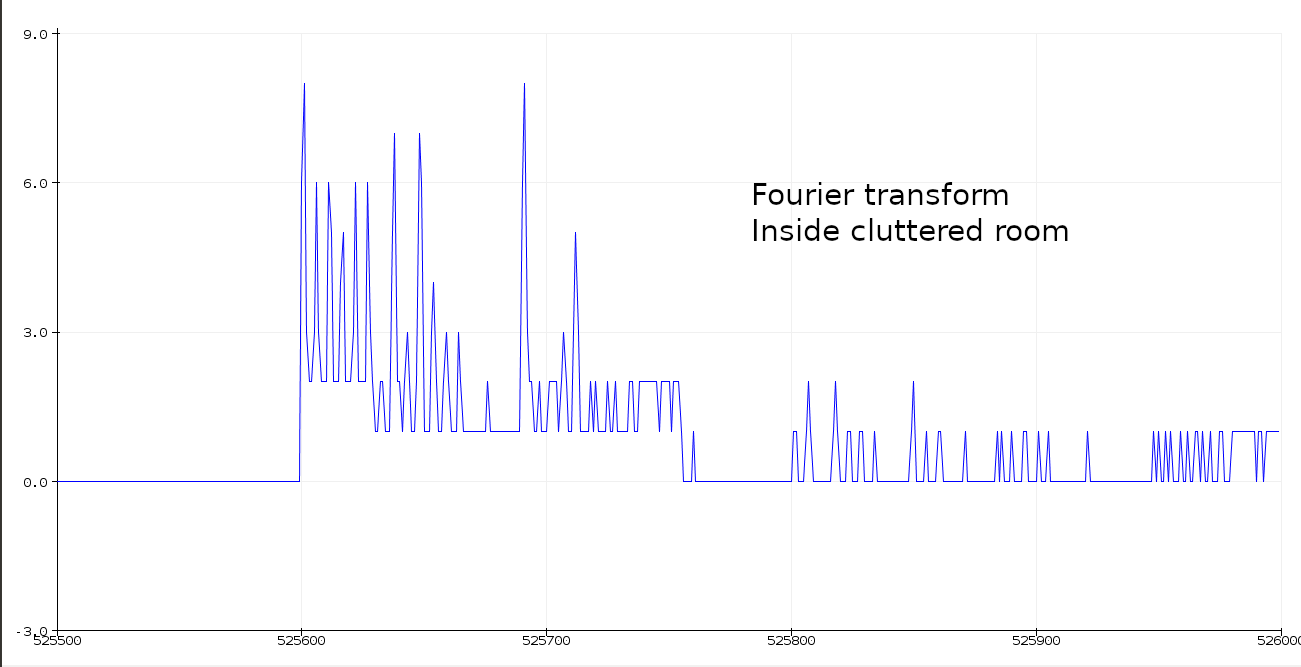
• More test using Fourier Transform and Oscilloscope

    Capt. Flatus O'Flaherty ☠05/29/2021 at 08:57 0 comments

    I thought it would be a good idea to make some side by side comparisons of the unit operating inside a clutter room and outside, pointing up in the air. A digital high pass filter was used to set all the low frequency fundamentals and first set of harmonics on the FT to zero.

    As can be seen, there are a couple of spikes about 1/3 of the way along the horizontal axis on the cluttered room FT that are different from the open air, but it's not particularly obvious. There should be more spikes beyond the 3m mark, which is about 1/2 way along the horizontal, but there's nothing there.

    The varactor tuning pin was given a triangular voltage signal as shown below and there was no discernible difference between inside and outside:

    I'm thinking that the IVS-362 is under powered and faulty :(

  • Diagnosing range issues

    Capt. Flatus O'Flaherty ☠05/27/2021 at 10:39 0 comments

    Apparently the IVS-362 should have a range of 20m, so something is wrong!

    These are some oscilloscope screenshots with the signal generator set to 200Hz with a voltage amplitude of 2.7 volts:

    Channel IF1:


    Channel IF2:

    These readings were taken in a cluttered indoor environment with plenty of reflective objects in the 3 to 5 m range. But the module does not seem to be very responsive.

  • Static FMCW test with Fourier Transform

    Capt. Flatus O'Flaherty ☠05/26/2021 at 16:23 0 comments

    The IVS-362 radar module was firstly calibrated by pointing it up into the air and then a 500mm x 500mm metal sheet was positioned about 3m directly in front of it. The FT graph above clearly shows a set of readings indicating distance. We expected the set of spikes on the graph to move to the right slightly as the metal sheet was moved away, but the maximum range seems to be 3 m.

    The abbreviation FMCW stands for Frequency-modulated continuous-wave radar.

  • Fourier Transform

    Capt. Flatus O'Flaherty ☠05/12/2021 at 10:37 0 comments


    On the right hand side is displayed readings from the oscilloscope with red being the output trianglular wave which feeds into the varactor input of the radar module. The blue trace is the output from the radar, amplified by the 2 stage op amp. The signal generator on the 'scope is not great quality, as can be seen by it's severe grainyness. However, on the left hand side, the FT generated by the Feather M4 expres still manages to seperate the poignant frequencies that give an indication of object size and distance from the sensor. Code for the FT is given below.
     /* This example shows the most basic usage of the Adafruit ZeroFFT library.
     * it calculates the FFT and prints out the results along with their corresponding frequency
     * 
     * The signal.h file constains a 200hz sine wave mixed with a weaker 800hz sine wave.
     * The signal was generated at a sample rate of 8000hz.
     * 
     * Note that you can print only the value (coment out the other two print statements) and use
     * the serial plotter tool to see a graph.
     */
    
    #include "Adafruit_ZeroFFT.h"
    #include "signal.h"
    
    //the signal in signal.h has 2048 samples. Set this to a value between 16 and 2048 inclusive.
    //this must be a power of 2
    // #define DATA_SIZE 1024
    #define DATA_SIZE 1024 // This is compatible with Arduino serial plotter where x axis ring buffer cant be changed from 500.
    // To make the actual plot, data size is reduced to 1000 and then divided by 2.
    
    // the sample rate:
    #define FS 39700 // Limited by speed of analogRead
    
    int16_t data[DATA_SIZE];
    int16_t bigData[DATA_SIZE];
    
    // the setup routine runs once when you press reset:
    void setup() 
    {
      Serial.begin(115200);
      while(!Serial); //wait for serial to be ready
    
     /*  // run the FFT
      ZeroFFT(signal, DATA_SIZE);
    
      // data is only meaningful up to sample rate/2, discard the other half
      for(int i=0; i<DATA_SIZE/2; i++)
      {
        
        //print the frequency
        //Serial.print(FFT_BIN(i, FS, DATA_SIZE));
        //Serial.print(" Hz: ");
    
        //print the corresponding FFT output
        //Serial.println(signal[i]);
      }
     */
    }
    
    void loop() 
    {
    
      for(int i=0; i<DATA_SIZE; i++)
      {
        bigData[i] = 0;
      }
    
      int32_t avg = 0;
      unsigned long beforeMicros = micros();
      int k = 50;
    
      for(int j=0; j<k; j++)
      {
        for(int i=0; i<DATA_SIZE; i++)
        {
          int16_t val = analogRead(A2);
          // delayMicroseconds(50);
          // delayMicroseconds(10); // ( 1u = 1MHz, 10u = 100 KHz, 100u = 10KHz)
          avg += val;
          data[i] = val;
        }
        unsigned long afterMicros = micros();
        float totalMicros = afterMicros - beforeMicros;
    
        //remove DC offset and gain up to 16 bits
        avg = avg/DATA_SIZE;
        for(int i=0; i<DATA_SIZE; i++) data[i] = (data[i] - avg) * 64;
        
        //run the FFT
        ZeroFFT(data, DATA_SIZE);
    
        for(int i=0; i<DATA_SIZE; i++)
        {
          bigData[i] = data[i] + bigData[i];
        }
      }
      
      int dataMax = 0;
      int dataMaxIndex = 600;
    
      for(int i=0; i<DATA_SIZE; i++)
      {
        data[i] = bigData[i]/k;
        // Find whichvalue of i gives the fundamental frequency:
        if(data[i] > dataMax)
        {
          dataMax = data[i];
          dataMaxIndex = i;
        }
      }
    
      int fundamental_center = dataMaxIndex;
      int fundamental_1 = fundamental_center - 4;
      int fundamental_2 = fundamental_center - 3;
      int fundamental_3 = fundamental_center - 2;
      int fundamental_4 = fundamental_center - 1;
      int fundamental_5 = fundamental_center + 0;
      int fundamental_6 = fundamental_center + 1;
      int fundamental_7 = fundamental_center + 2;
      int fundamental_8 = fundamental_center + 3;
      int fundamental_9 = fundamental_center + 4;
    
      //data is only meaningful up to sample rate/2, discard the other half
      for(int i=0; i<(DATA_SIZE-24)/2; i++) // The '-24' is to try get the data to fit in Arduino serial plot window.
      {
        // Try and remove the fundamental frequency from the plot:
        if((i==fundamental_1)||(i==fundamental_2)||(i==fundamental_3)||(i==fundamental_4)||(i==fundamental_5)||(i==fundamental_6)||(i==fundamental_7)||(i==fundamental_8)||(i==fundamental_9))
        {
          data[i] = 0;
          // Serial.println(data[i]);
        }
        if(data[i]<0)
        {
          data[i]=0;
          // Serial.print(" negative value detected at index: ");Serial.println(i);...
    Read more »

  • The Scope reveals all

    Capt. Flatus O'Flaherty ☠05/10/2021 at 00:48 0 comments

    This is pretty much the expected result for non-Doppler static object detection, so all is good. Next task is to get this waveform into a RPi via an ADC without turning it into toast. Some lowering of the voltage and removal of DC offset may be required. Then, a bit of Fourier transform magick to pull out the hidden frequency and amplitude elelments.

  • Ready for Signal Processing

    Capt. Flatus O'Flaherty ☠05/07/2021 at 09:47 0 comments

    The Radar module has been mounted on the DIY PCB with a 2 stage op amp for each signal output. Tested all ok. Great care needs to be taken to prevent damage to the module by static voltage. Next step is to hook up the oscilloscope and have a look at the output wave forms again.

  • PCB goes to Fab

    Capt. Flatus O'Flaherty ☠04/25/2021 at 07:43 0 comments

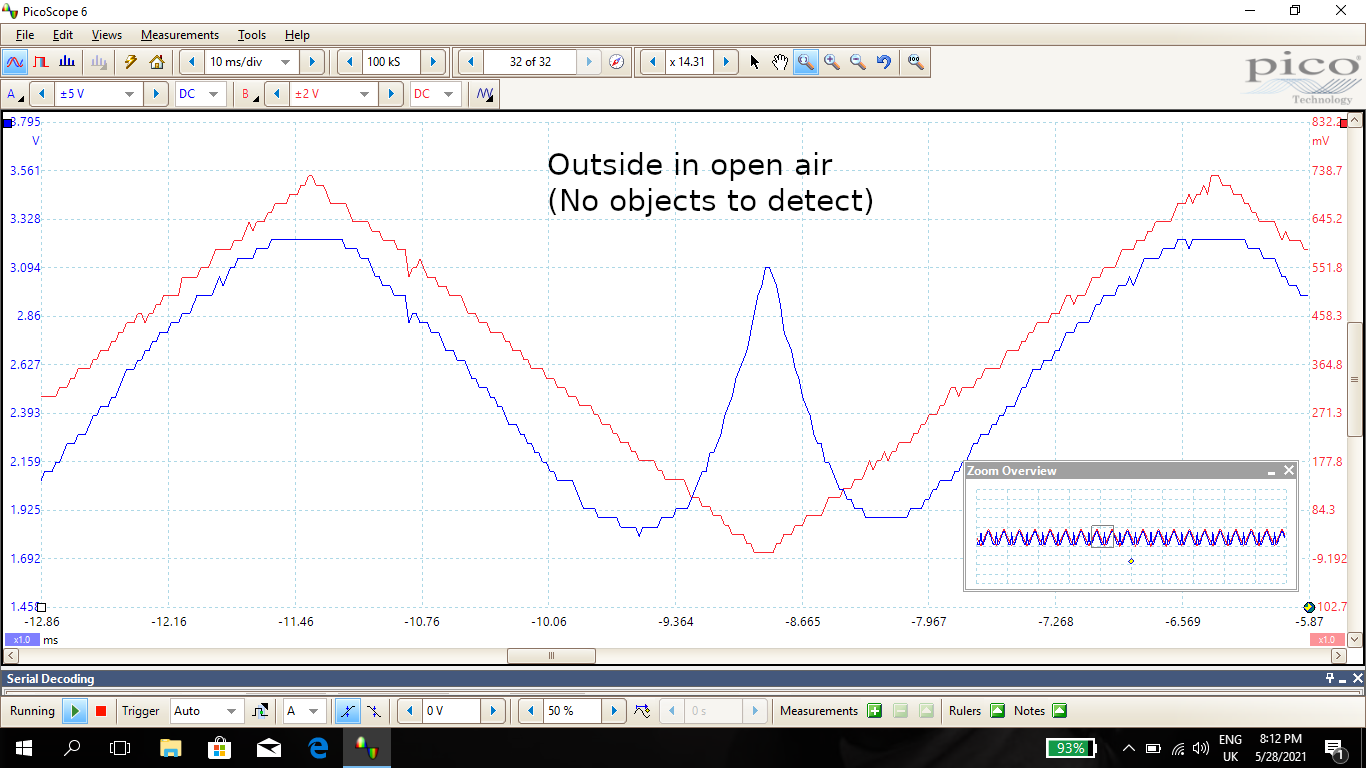
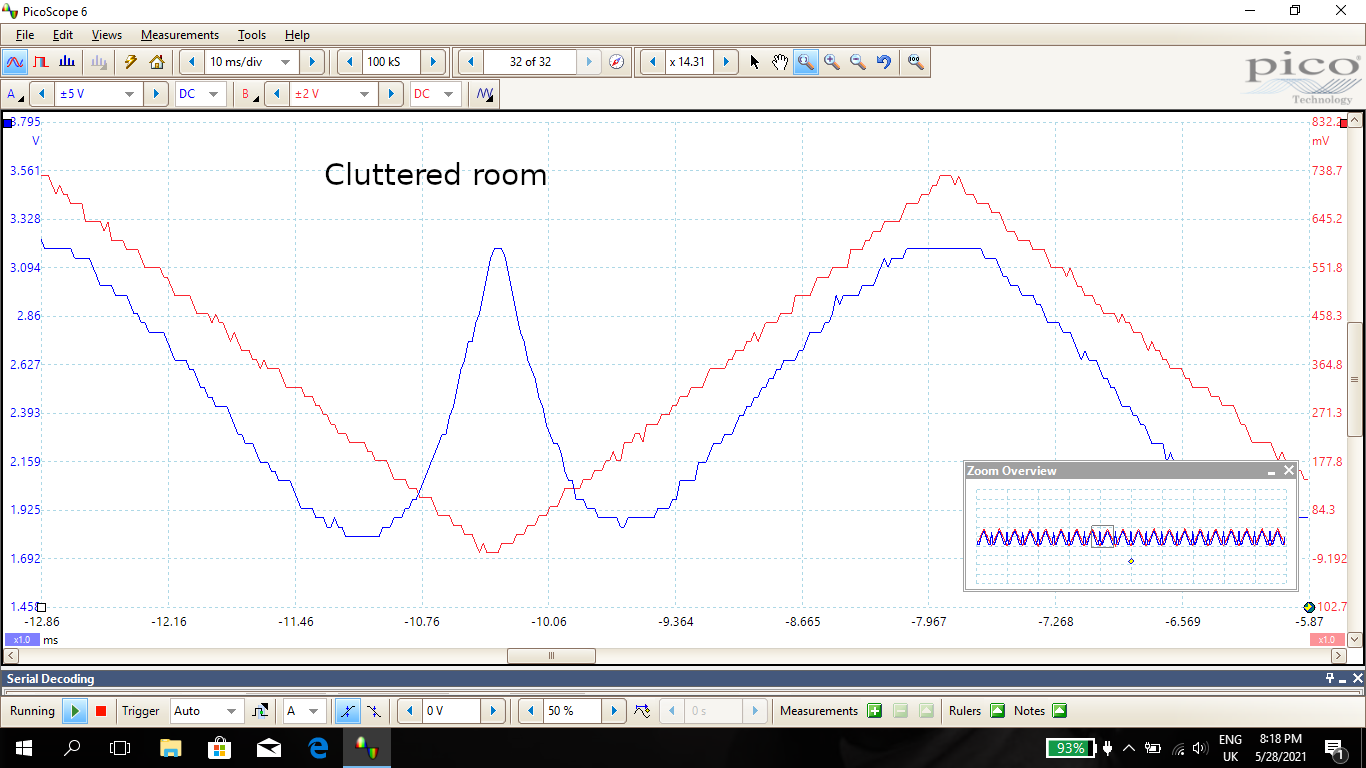
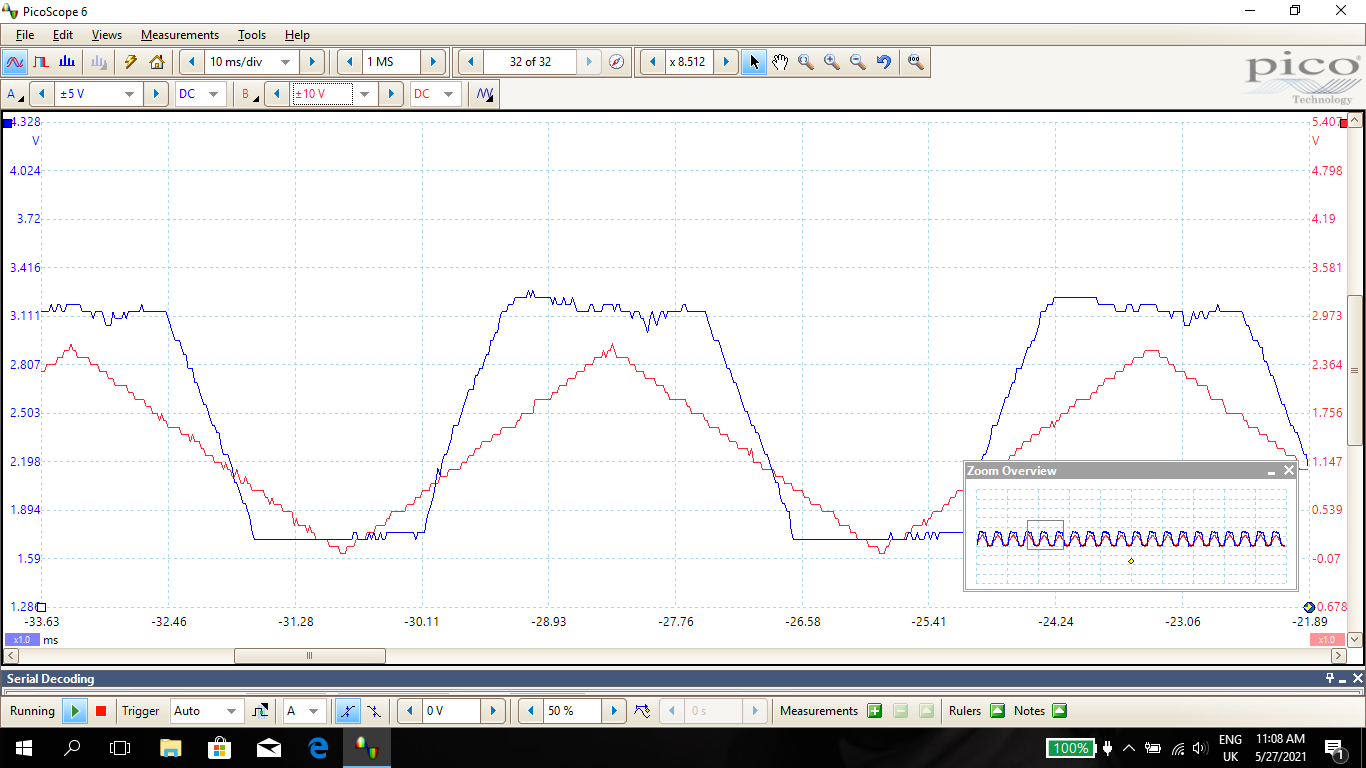
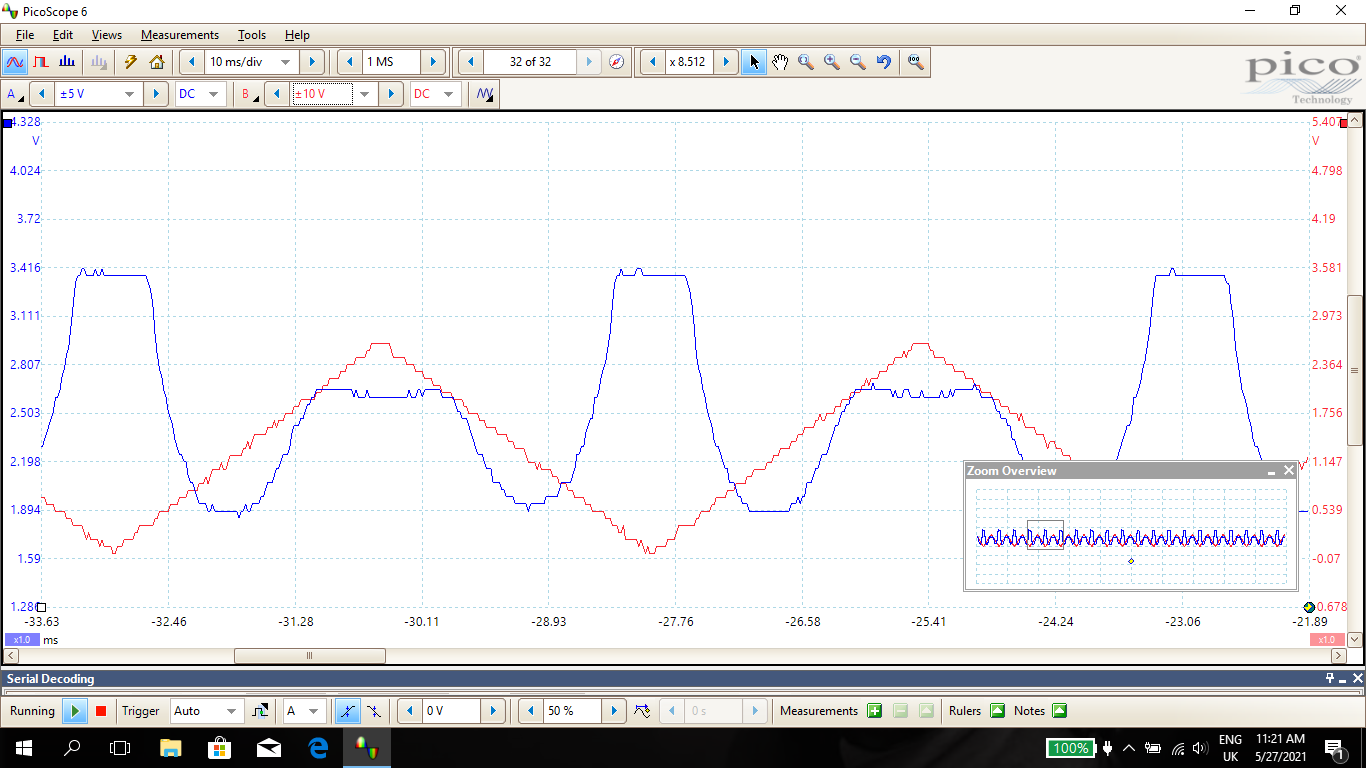
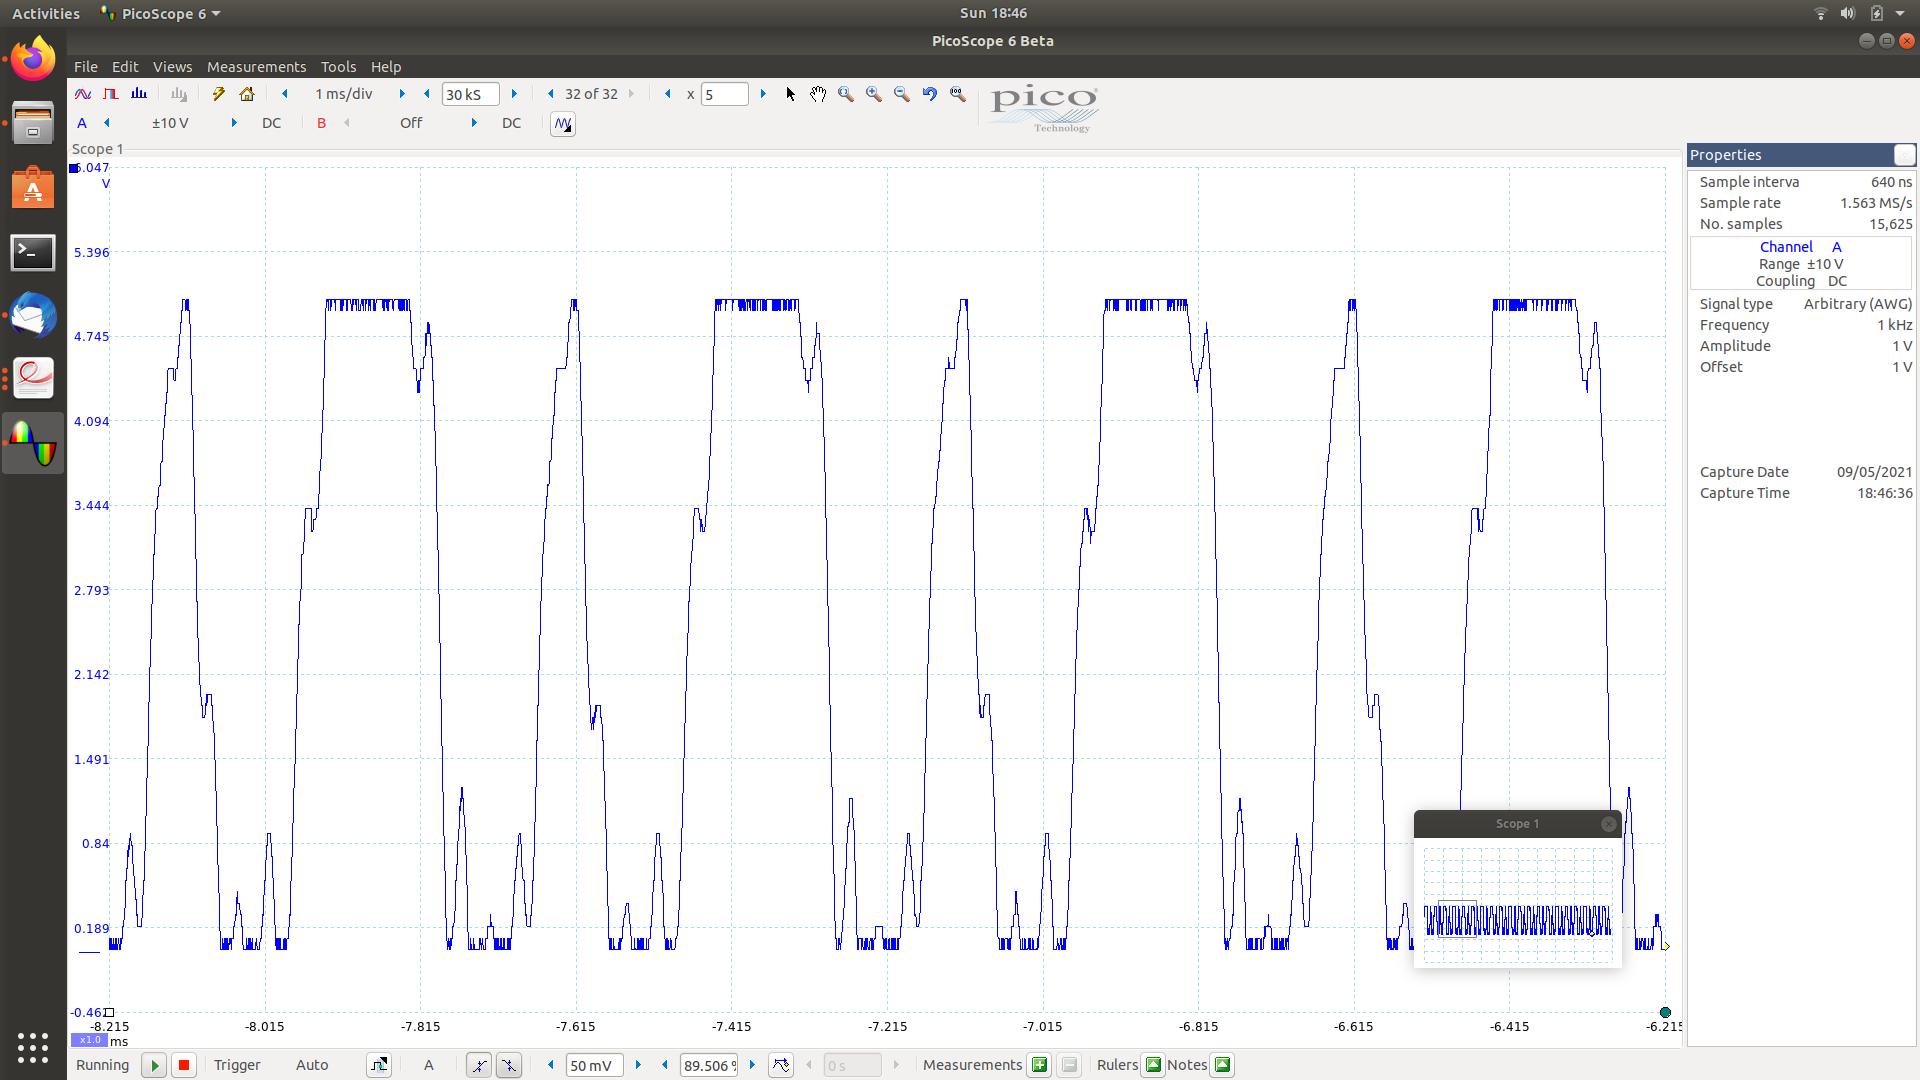
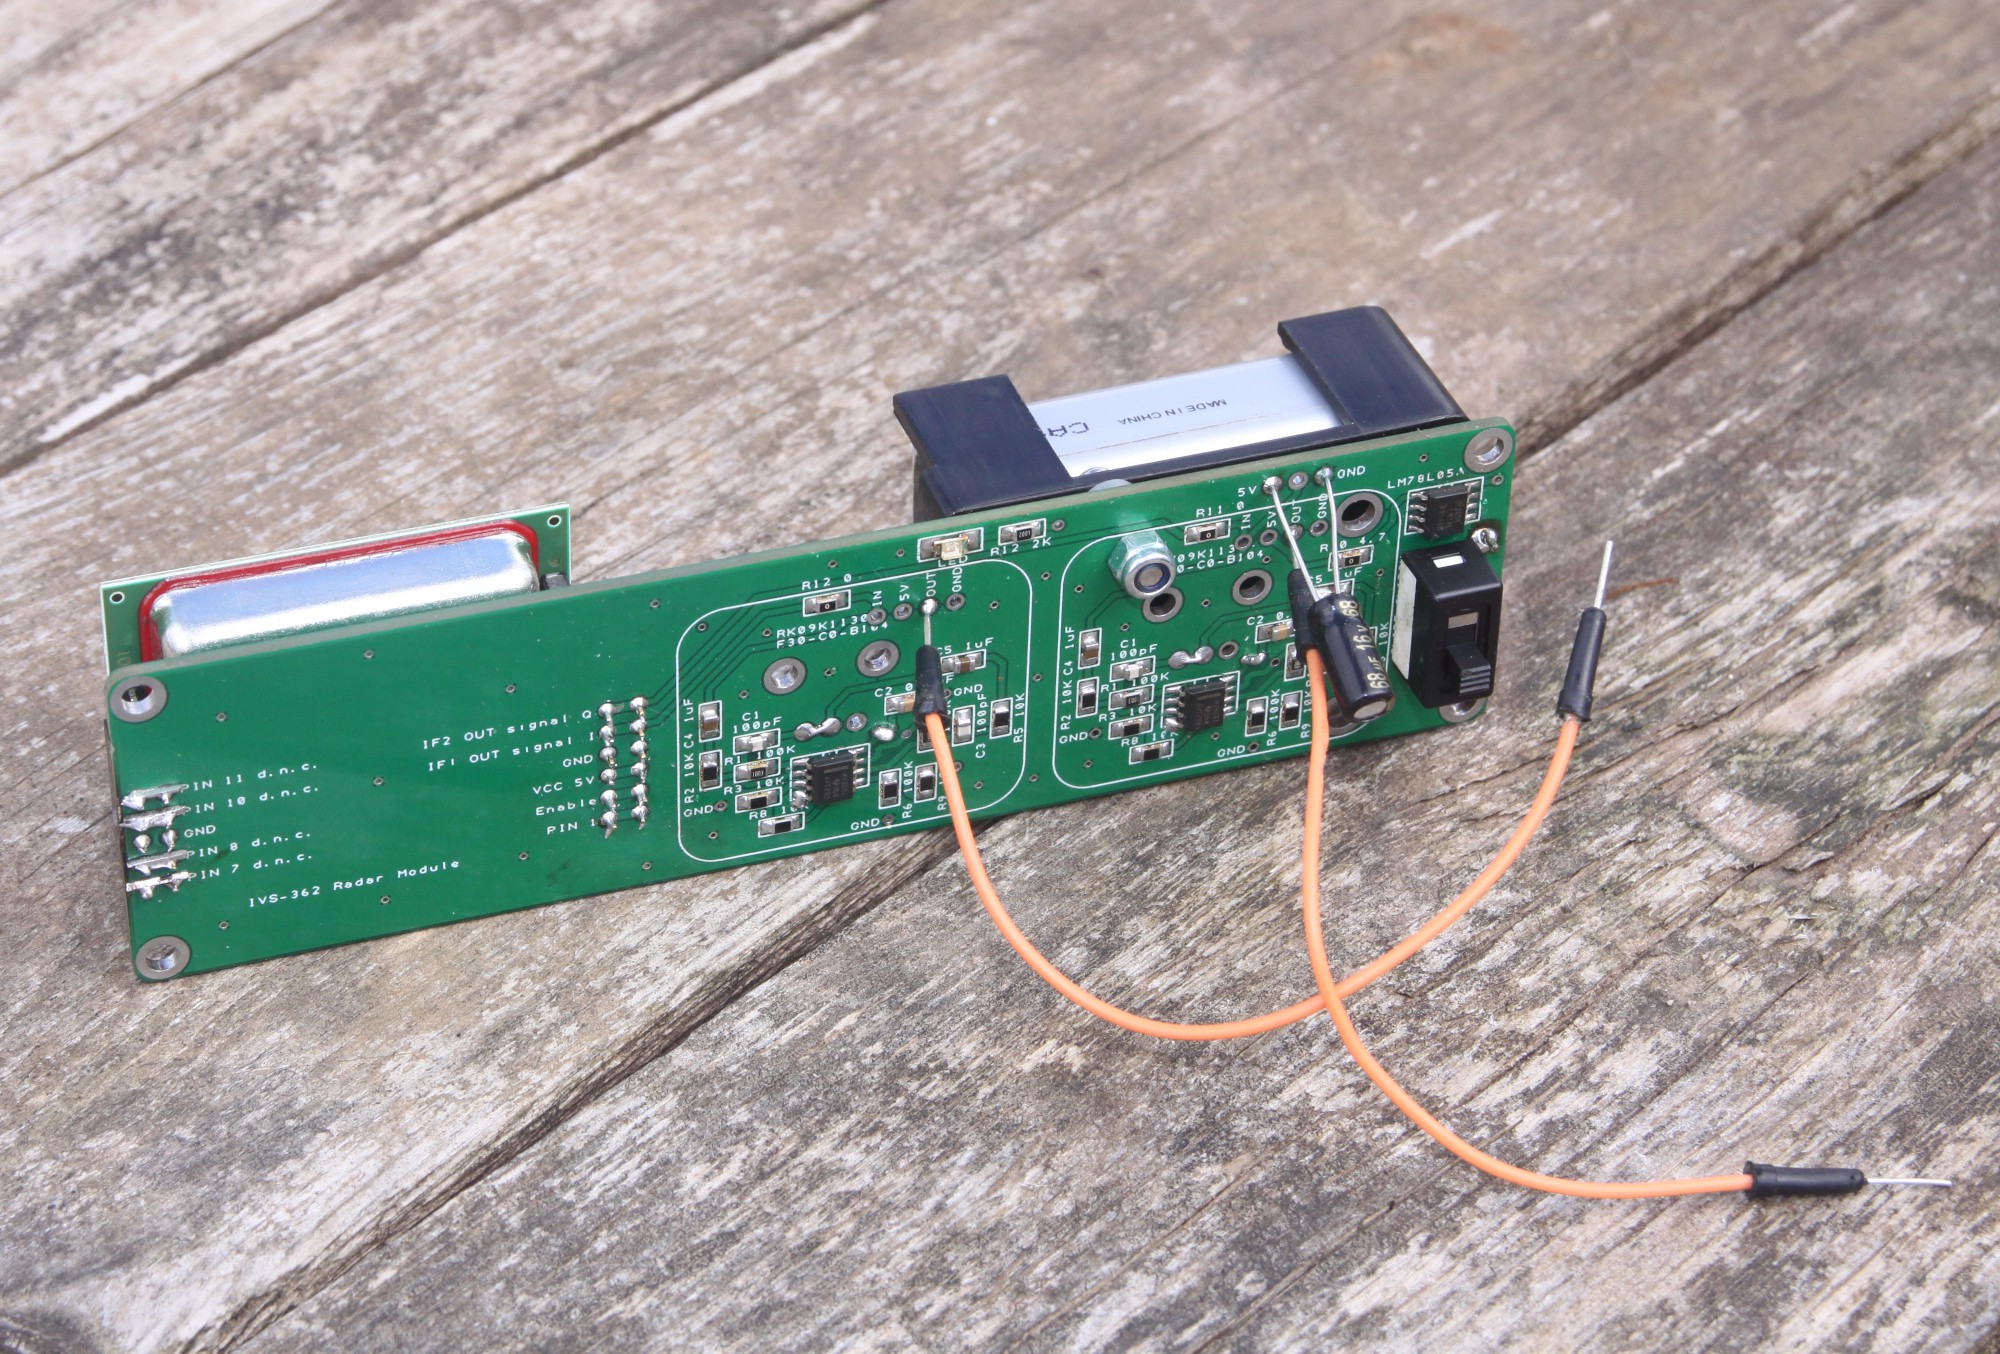
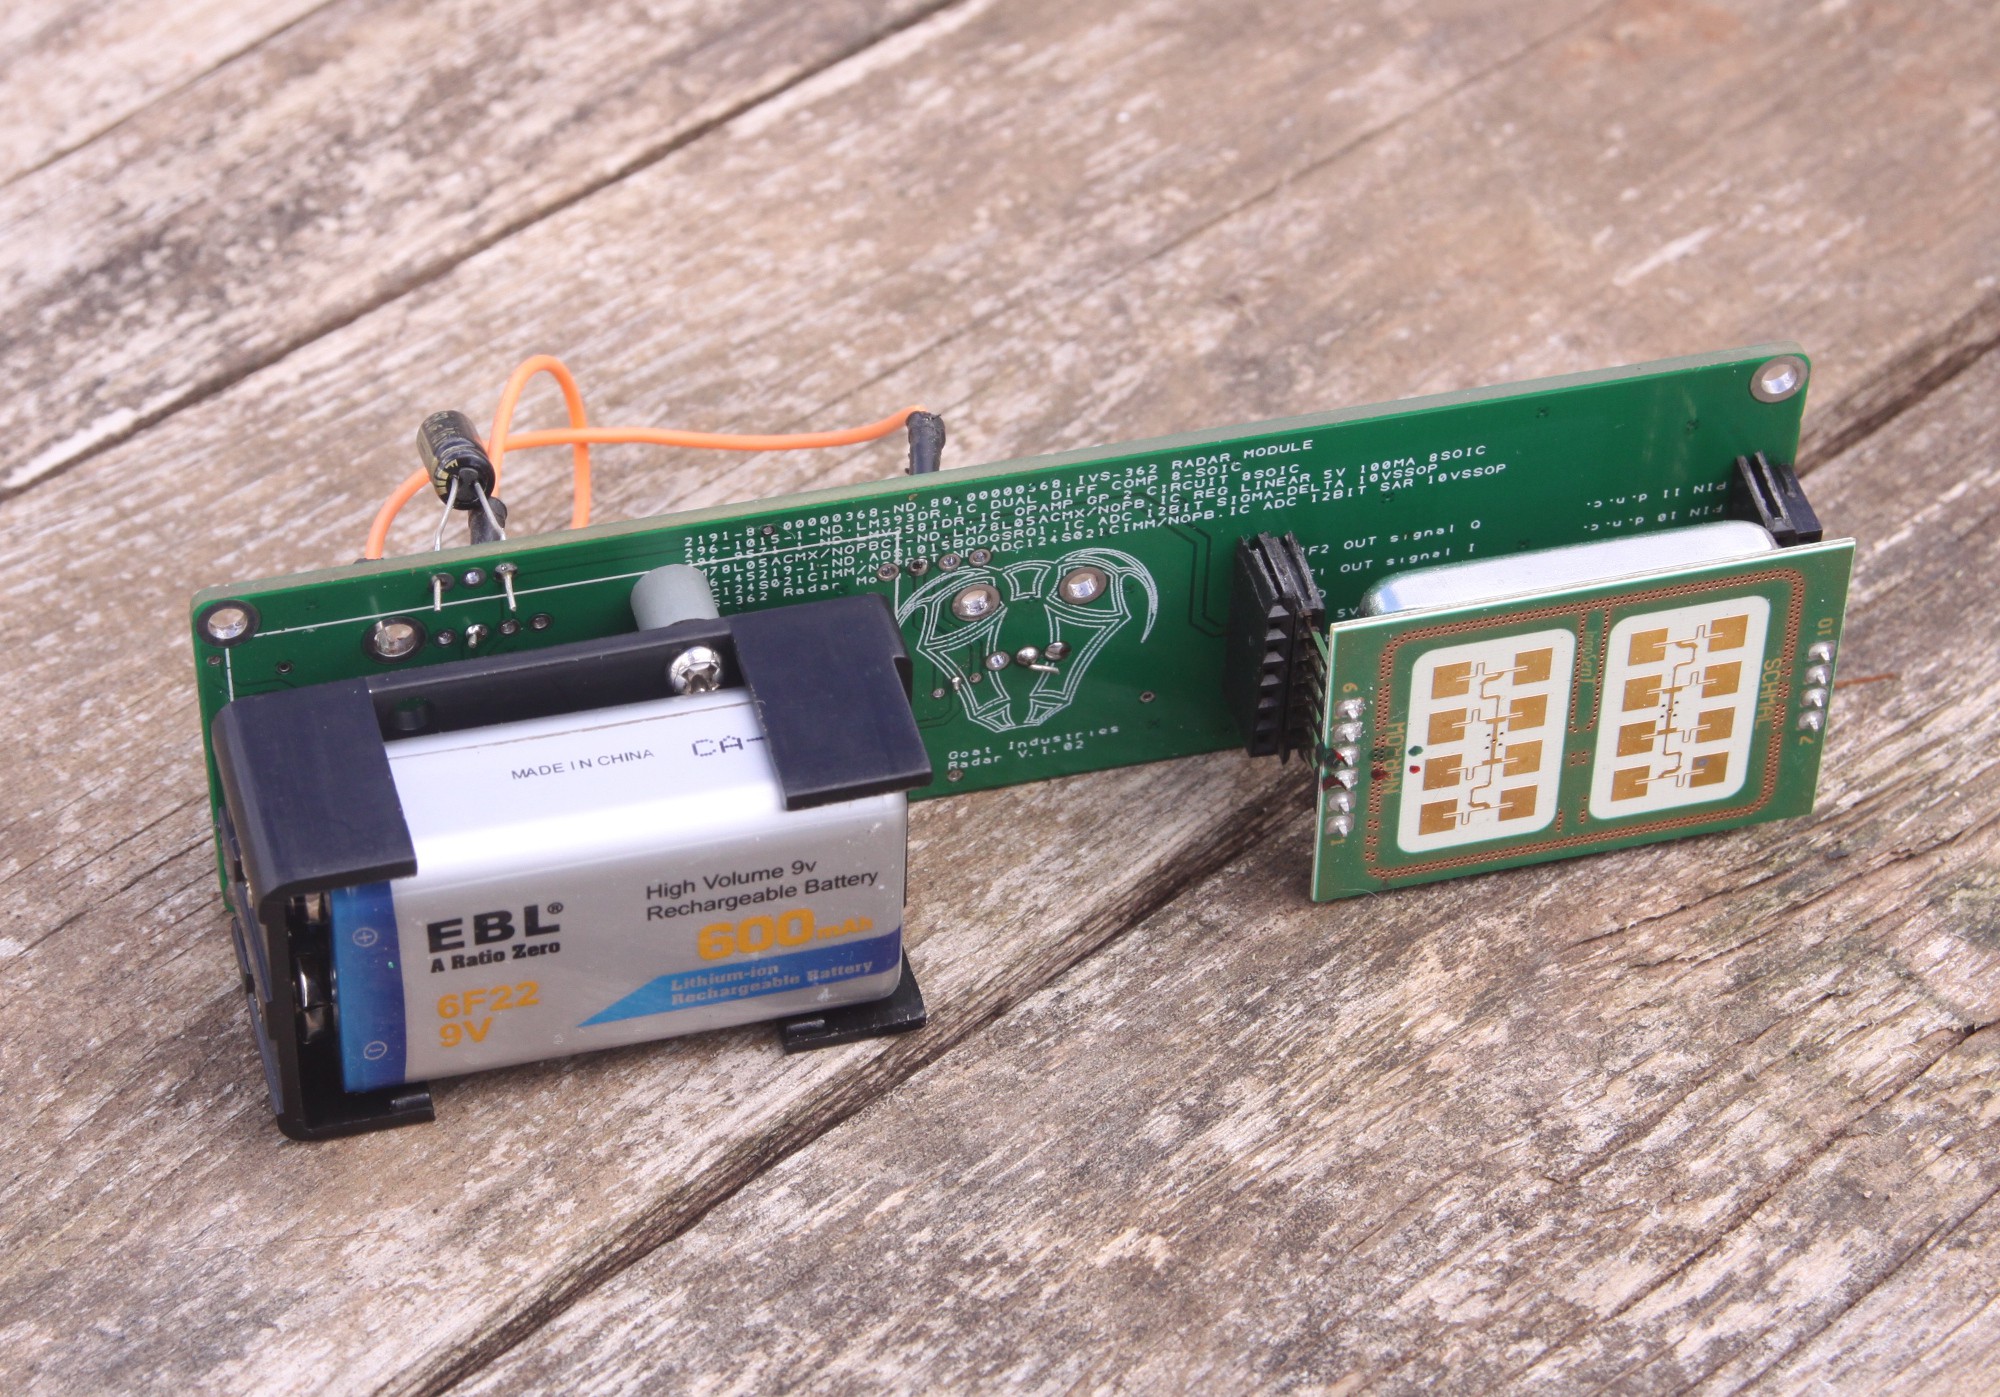
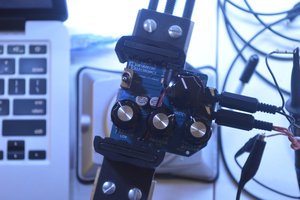
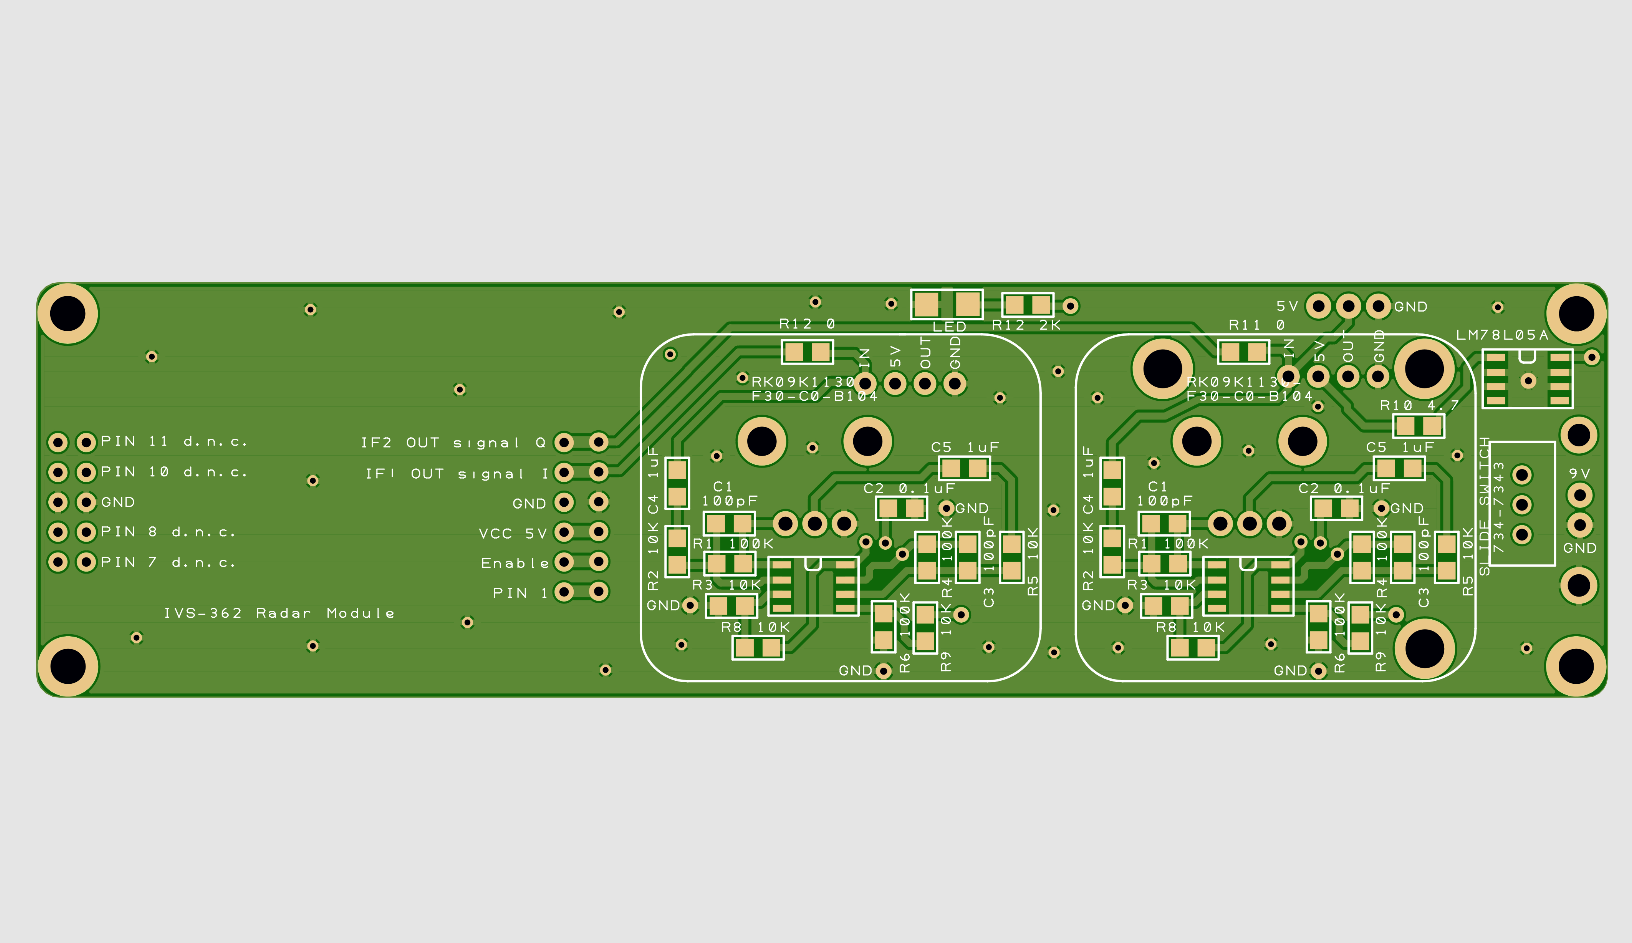
    Featuring mounts for the IVS 362 and the IPM 165C, with op amp circuits in the big white boxes with rounded corners. The IPM 165C has already been tested with oscilloscope and just needs the signal amplified for presentation to the ADC.The circuit schematic for the op amps is as below:
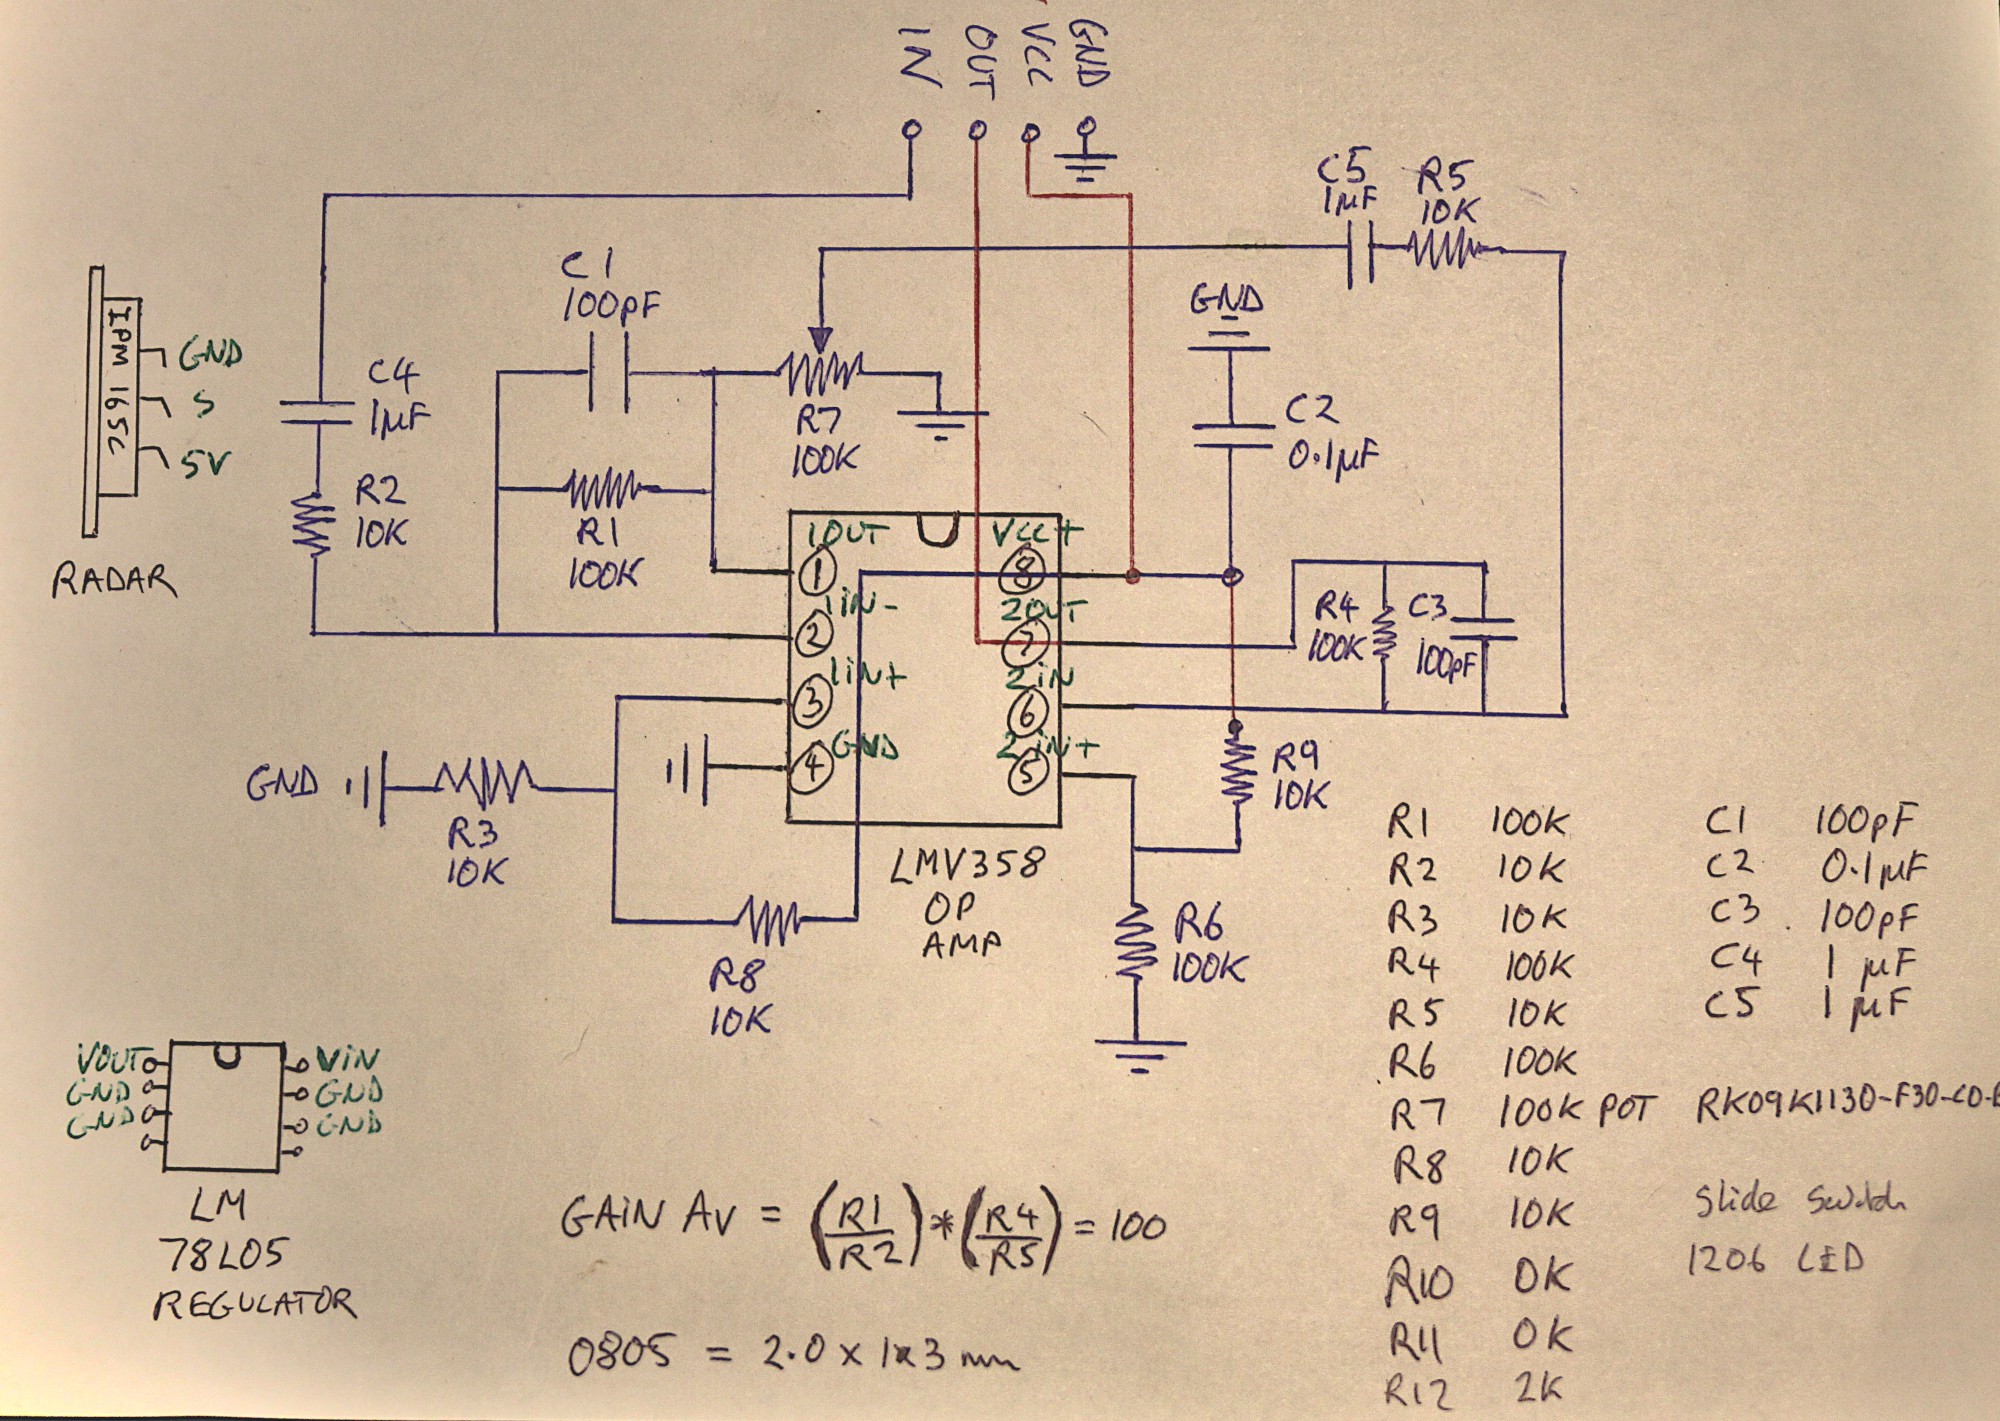