Introduction
Op amps are well known for their utilitarian prowess, performing many vital tasks underpinning analog circuit design. They add, subtract, integrate, differentiate, and amplify with great precision!
That’s all well and good… but how about the arts? Can an op amp create a drawing? That’s the essence of this project. Let’s see what we can do!
At first glance, op amps don’t seem to be the right tool for the job. But then they can perform mathematical operations, and math often generates visually appealing results. Examples are fractals, Lissajous curves, and even the positioning of seeds in a sunflower blossom!
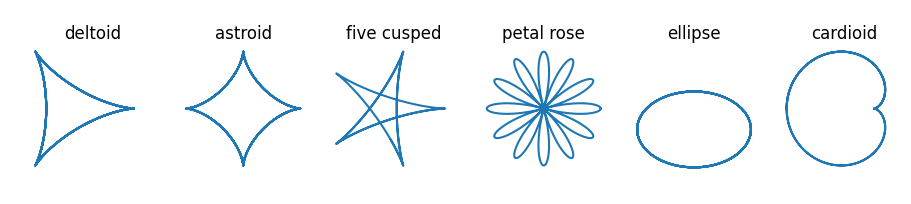
For this project, we’ll focus on curves called hypertrochoids and epitrochoids. These curves are produced by the well known Spirograph toy and produce all sorts of interesting patterns. As it turns out they can be generated by summing sinusoids of various frequencies and magnitudes. This is well within the capability of the mighty op amp!
Op Art's features include:
- Generates both hypotrochoids and epitrochoids
- Op amp & passive circuits only
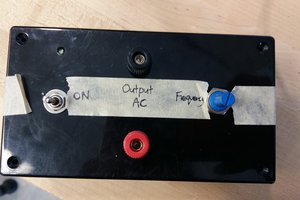
- Battery operation - two AAA alkaline or rechargeable cells
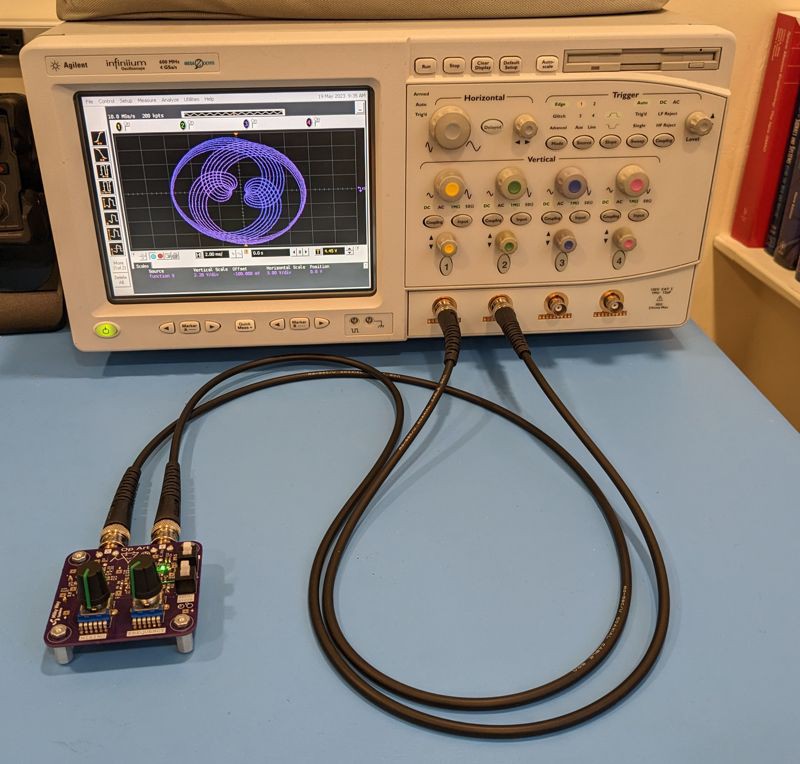
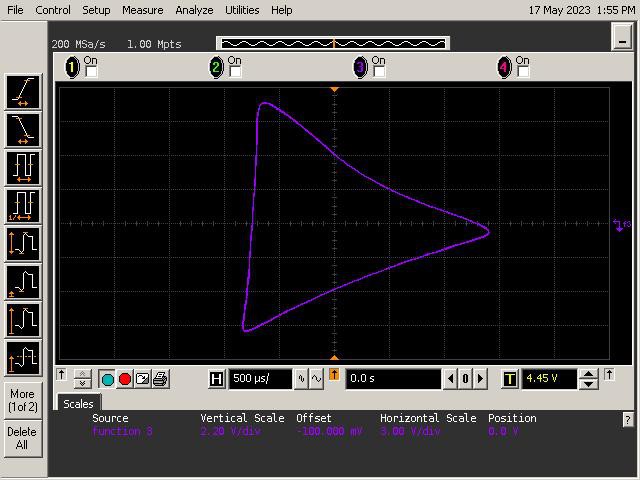
- Display using oscilloscope - via two BNC test cables
Spiro-Math
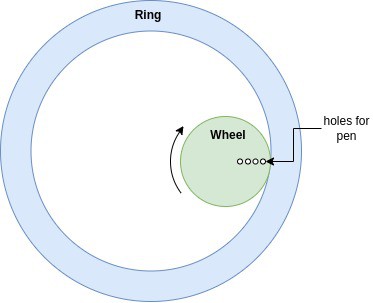
Op Art generates curves that can be created with the age-old Spirograph toy, which I had a lot of fun with as a child. For those who are not familiar, a Spirograph toy has two main parts - a ring and a wheel. The wheel has several holes into which a pen tip can be pressed. You place the wheel inside the ring, set a pen tip in one of the wheel's holes, and then roll the wheel along the inner perimeter of the ring. As the wheel rolls, it traces out a pattern. You can change the pattern by moving the pen to a different hole in the wheel, selecting a different size wheel, or even rolling the wheel on the outer perimeter of the ring. There are gear teeth on both the ring and wheel which keep them from slipping. The figure below shows the geometry of Spirograph.
To study the mathematics behind the Spirograph, we'll look at a simplified geometry shown below. The geometry consists of a circle within another circle. The inner circle rolls inside the perimeter of the outer circle without slipping. The inner circle has a red point indicating the position of a pen. The resulting curves traced out by the pen (red dot) are called hypotrochoids.
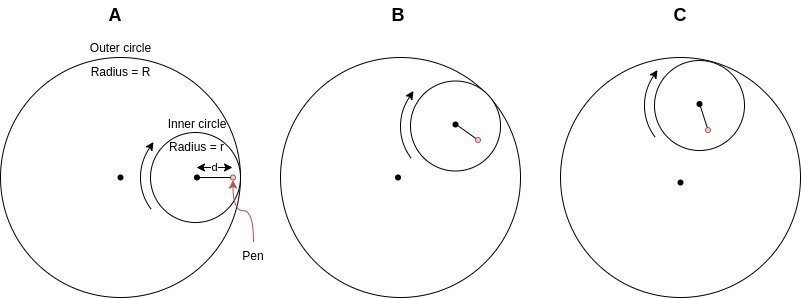
The inner circle's starting position is shown at left in column "A" of the figure above. The inner circle is then rolled clockwise, reaching the position in column "B", then the position in column "C", and so on.
If you look closely at the diagram you might notice that the pen's path follows two connected line segments or vectors. The first vector extends from the center of the small circle to the pen's position. It rotates clockwise around the center of the small circle. The second vector extends from the large circle's center to the small circles center. It rotates counterclockwise around the center of the large circle. The two vectors, which we'll call O and I are shown below.
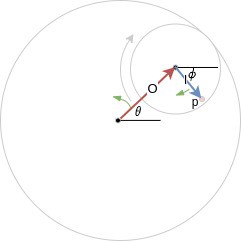
The pen position is simply the vector sum of O and I. So if we can describe both vectors, we can calculate the path that the pen takes. The magnitudes of the vectors O and I are pretty straightforward to find. I's magnitude is simply the pen position "d" defined in the previous figure. O's magnitude is the outer circle radius minus the inner circle radius, or R-r.
O's angle is defined as θ in the diagram. I's angle is shown as ɸ, however, it is dependent on θ and the geometry of the Spirograph. The relation between θ and ɸ can be found by equating arc lengths on the inner and outer circles. Reference [1] shows how, and provides the relation ɸ = θ * (R-r)/r. ...
Read more »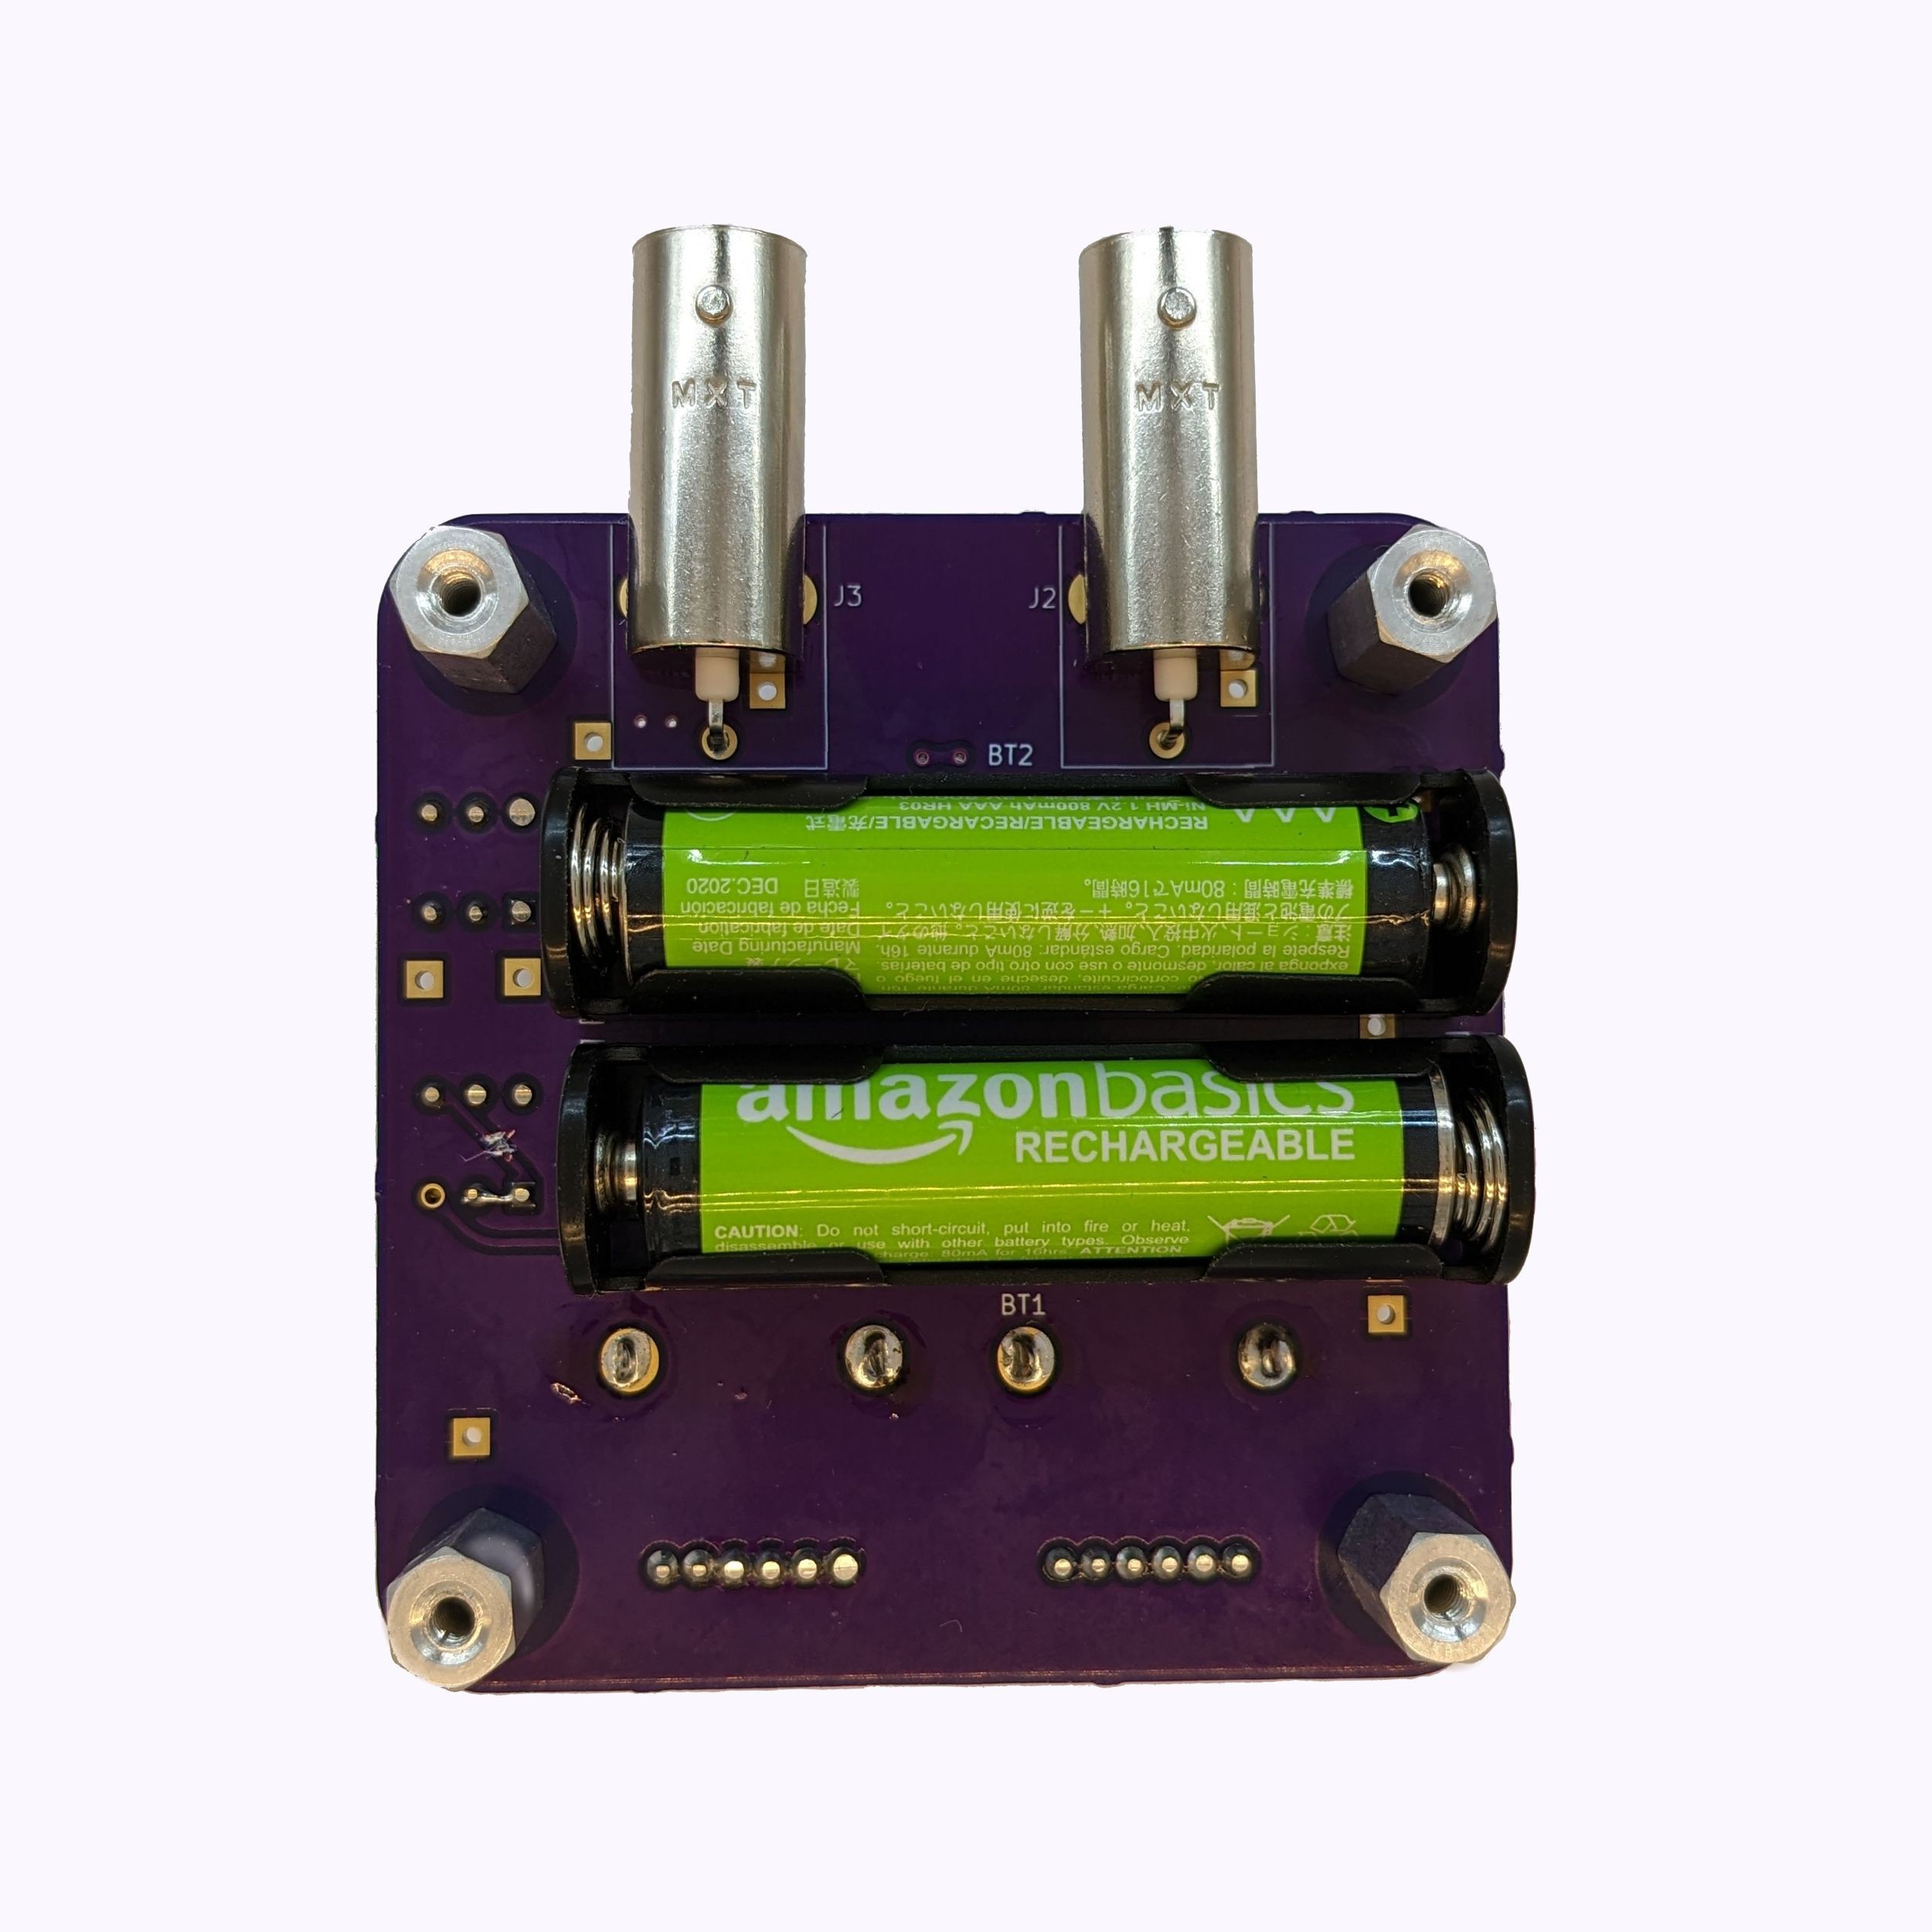


 Ellie T
 Mitsuru Yamada
 Sebastian
 Ghani Lawal