 Alex Shakespeare
With energy prices seemingly increasing all the time, I decided to build a couple of wall based information panels to help us manage costs - so far saving about £50 a month by using electricity more mindfully/at cheaper times.
The UK provider, Octopus energy, has a tariff called "Agile" where rates change every half hour, depending on general demand as well as how much wind/solar power is available on the grid.
These rates can change quite substantially, from 55p/kWh down to sometimes negative amounts, where you are paid to use electricity. To sign-up, please visit this link - you'll get £50 off and I'll also get a referral bonus if you do this.
The first of my information panels, pictured below, provides a current view of daily spend, a real time analog view of consumption and also the current electricity and gas rates I'm paying.
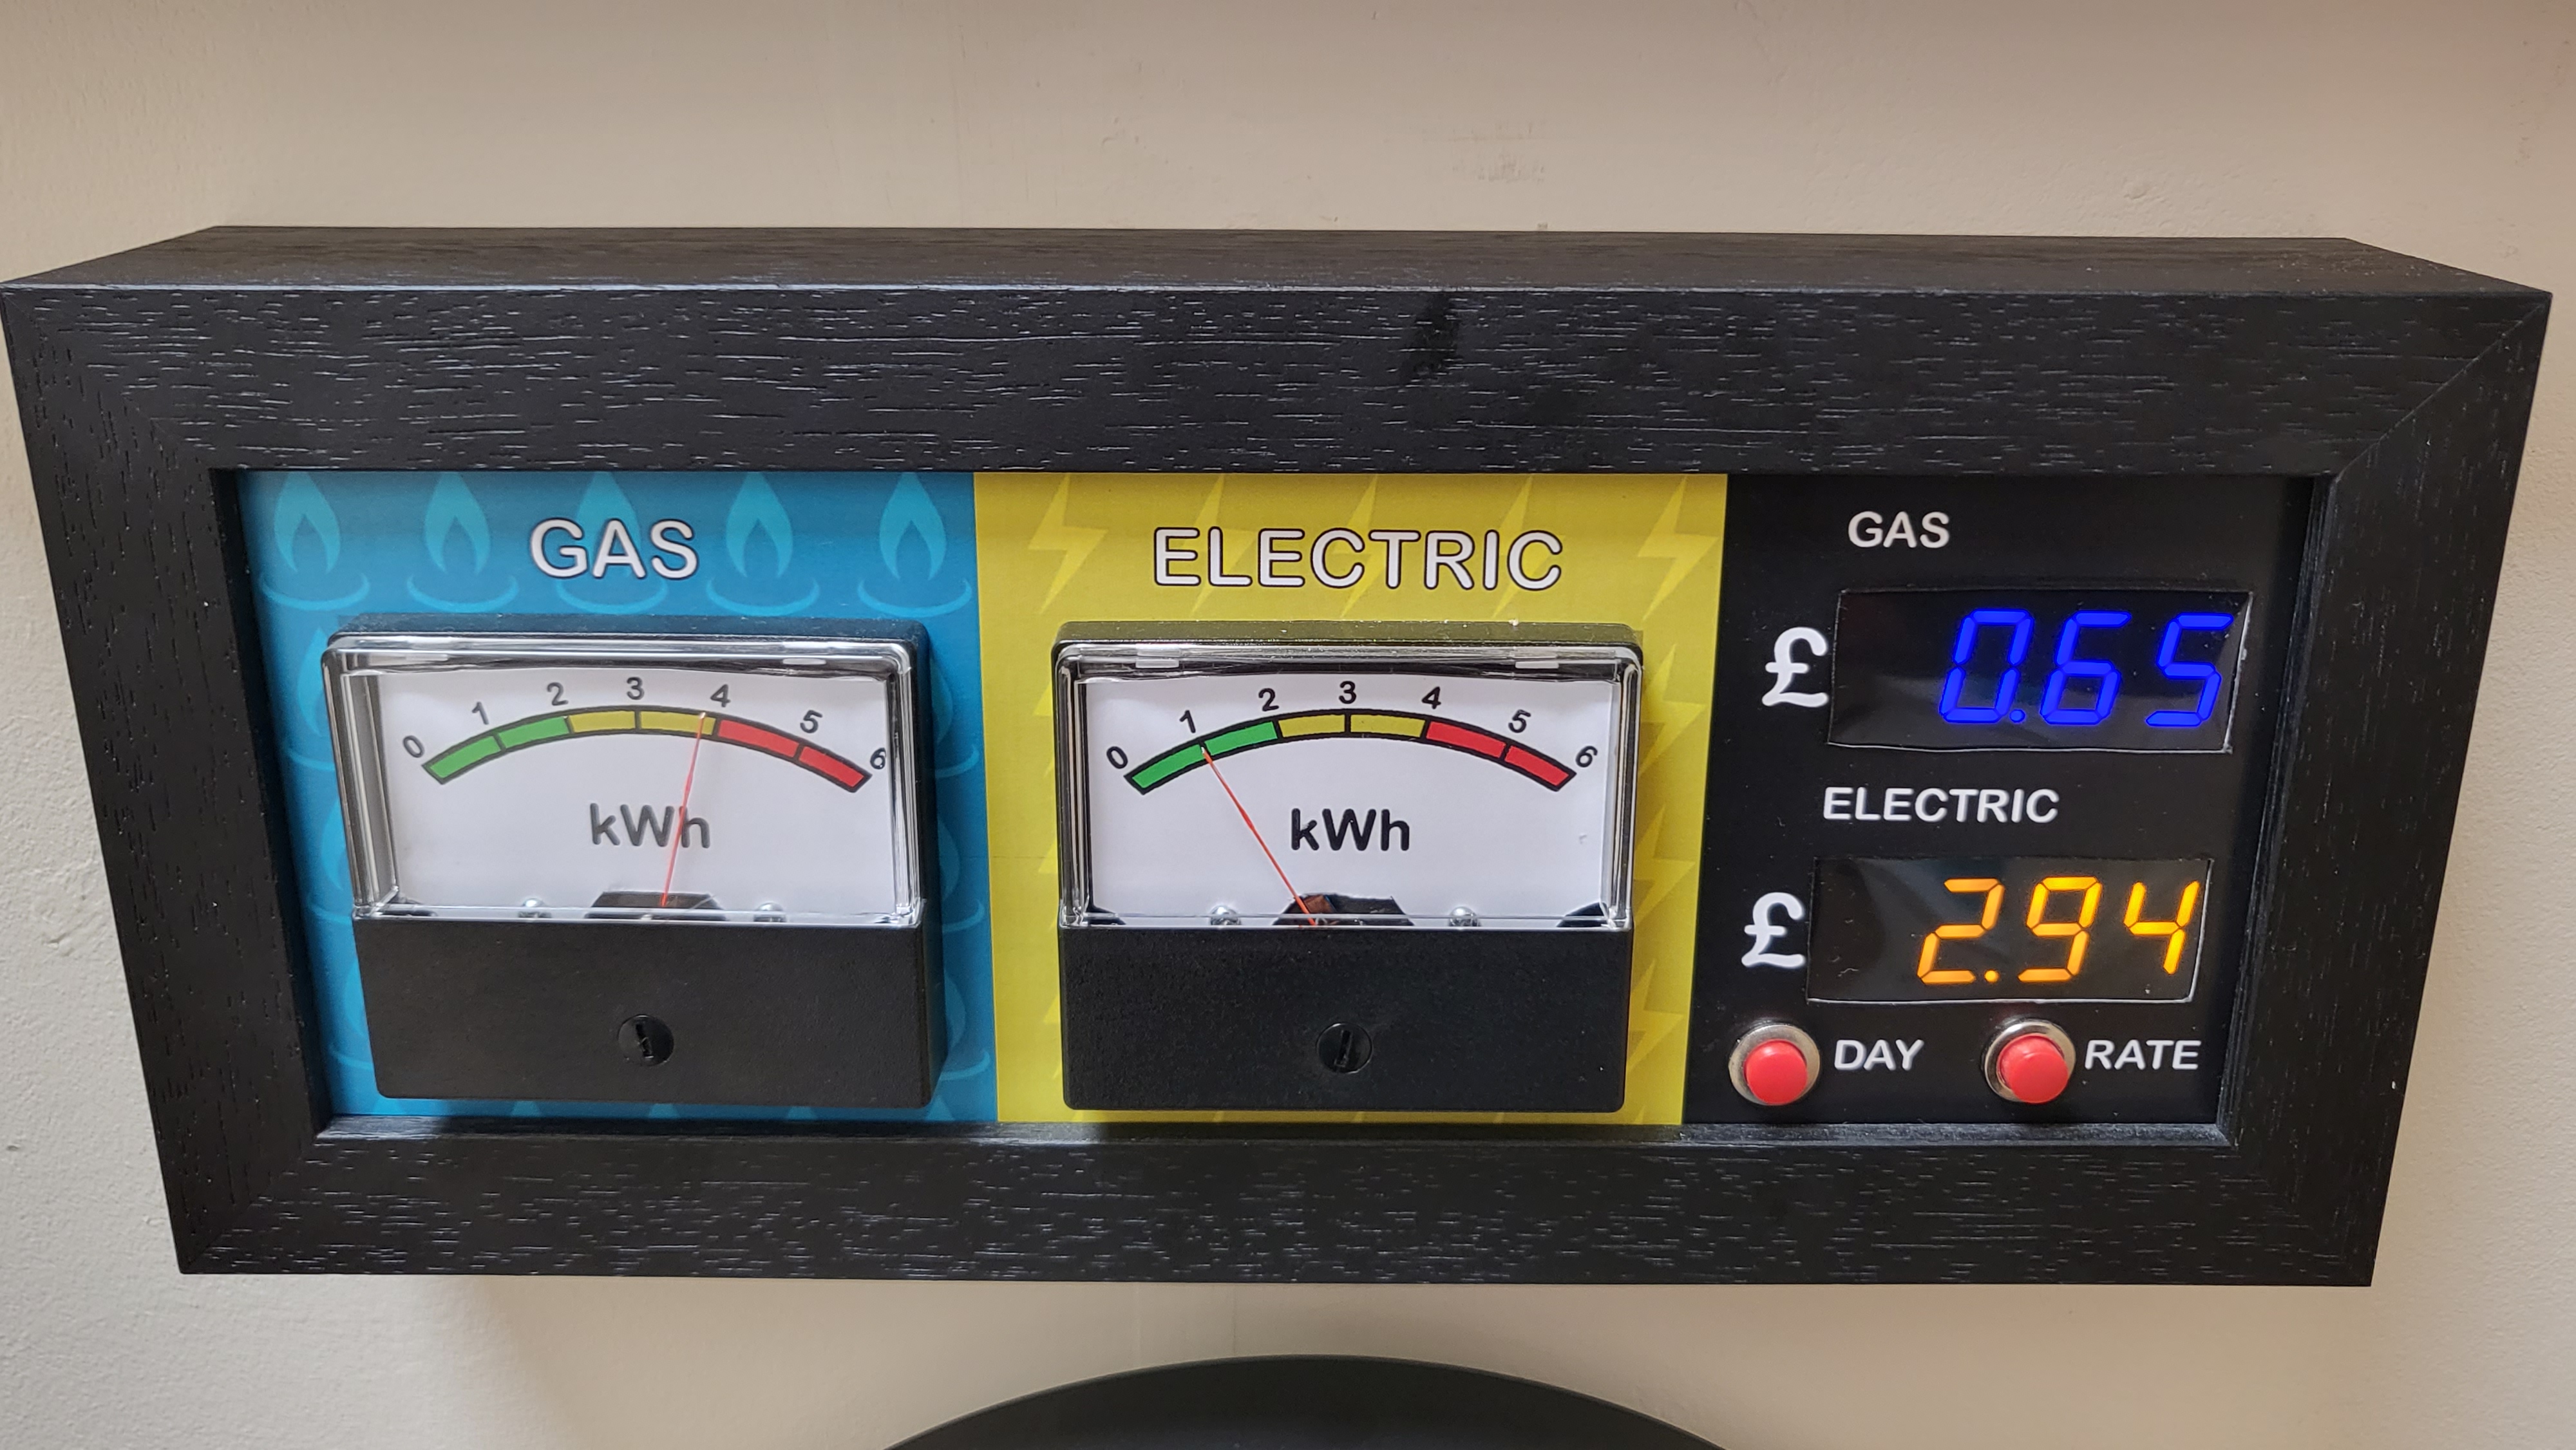
Driven by an ESP32 S2 Mini, this panel digests real-time readings from a Glow IHD device through MQTT, as well as readings/calculations from a Python script which updates every 30 minutes, using the GlowMarkt API and latest rate information from the Octopus API.
In terms of hardware, two HT16K33 driven 7 segment displays are attached as well as two 3V analog voltmeters - the scale on these has been replaced by a custom designed card which displays current real time consumption in kW for electricity, and a half hour approximation for gas consumption. Finally, two push switches swap the displays between today's consumption and the current rate being paid.
The second information panel is a bit more colourful, showing rates for the next 12 hours using an analog clock interface as shown below:
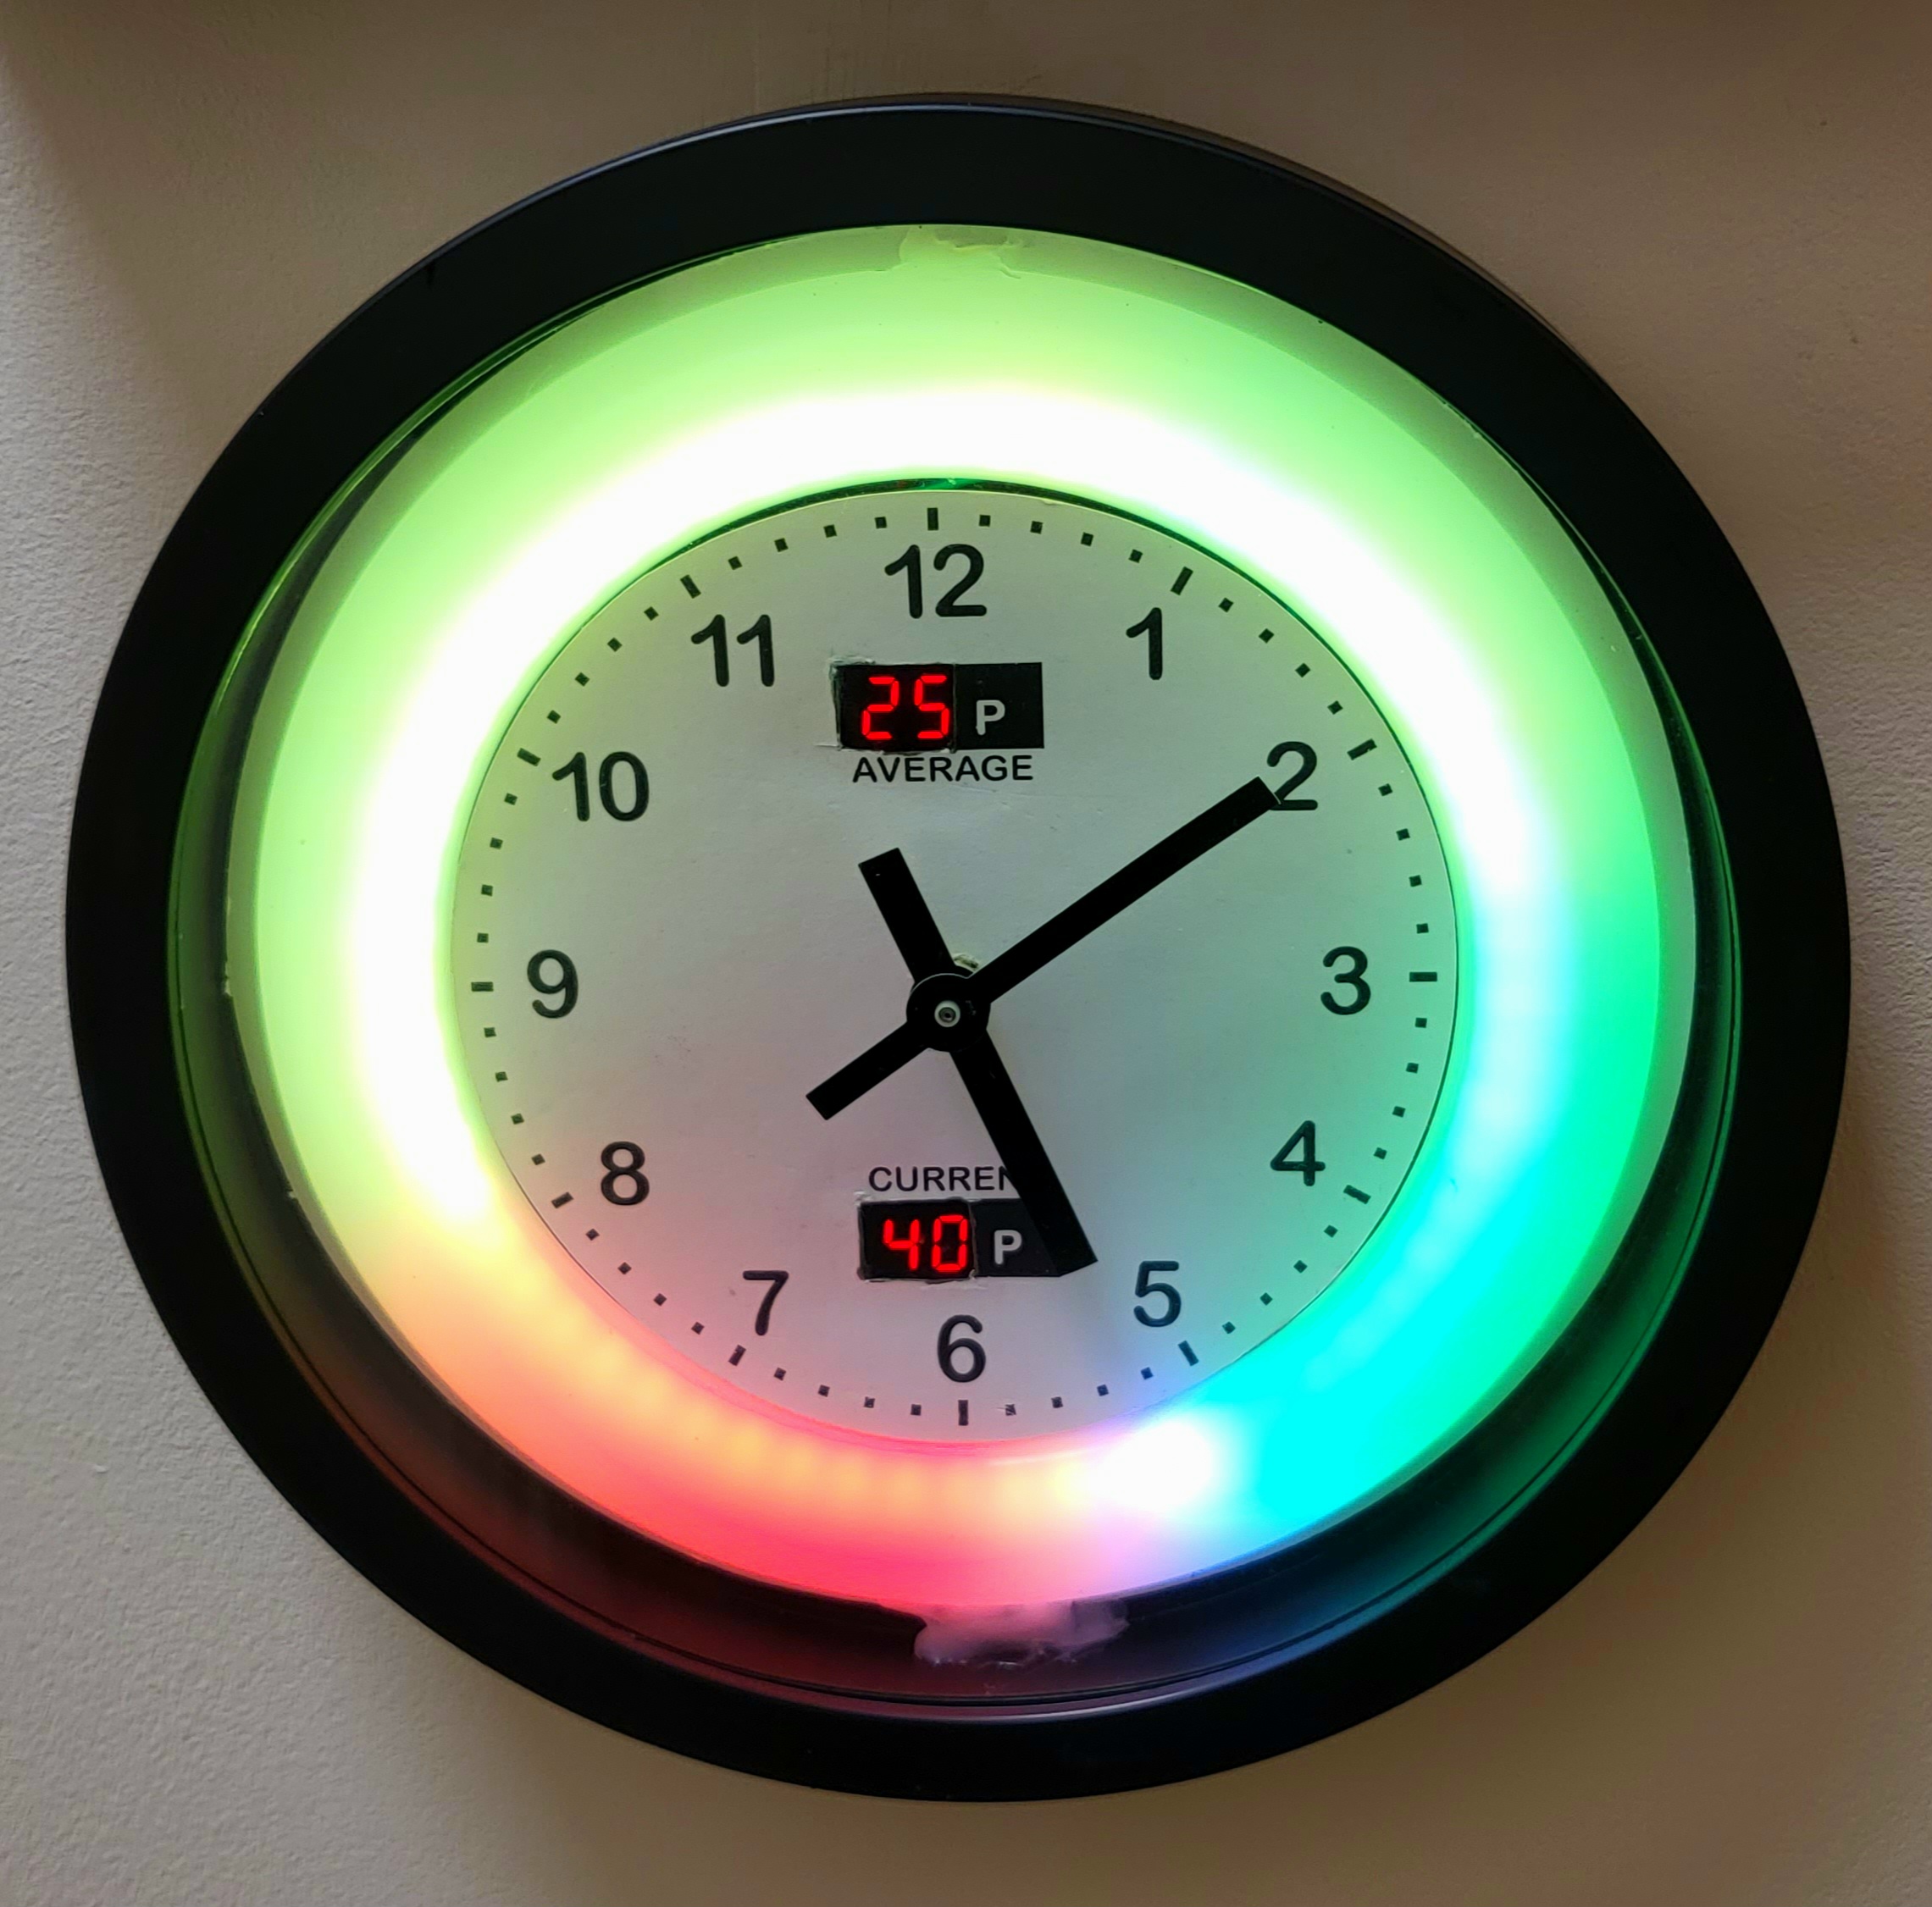
From the example above, green denotes when the rates are going to be cheaper/below average, on an increasing scale through yellow to red which indicates the most expensive time. White shows the current time on the ring, which will always be lined up with the hour hand in the middle. There is also a current and average rate display - useful for working out whether there is a big spike or exceptionally cheap electricity.
Finally, purple blocks, shown in the picture below, denote times where the electricity is free or when I will get paid to use electricity - this picture was taken around 5pm and shows negative overnight rates.
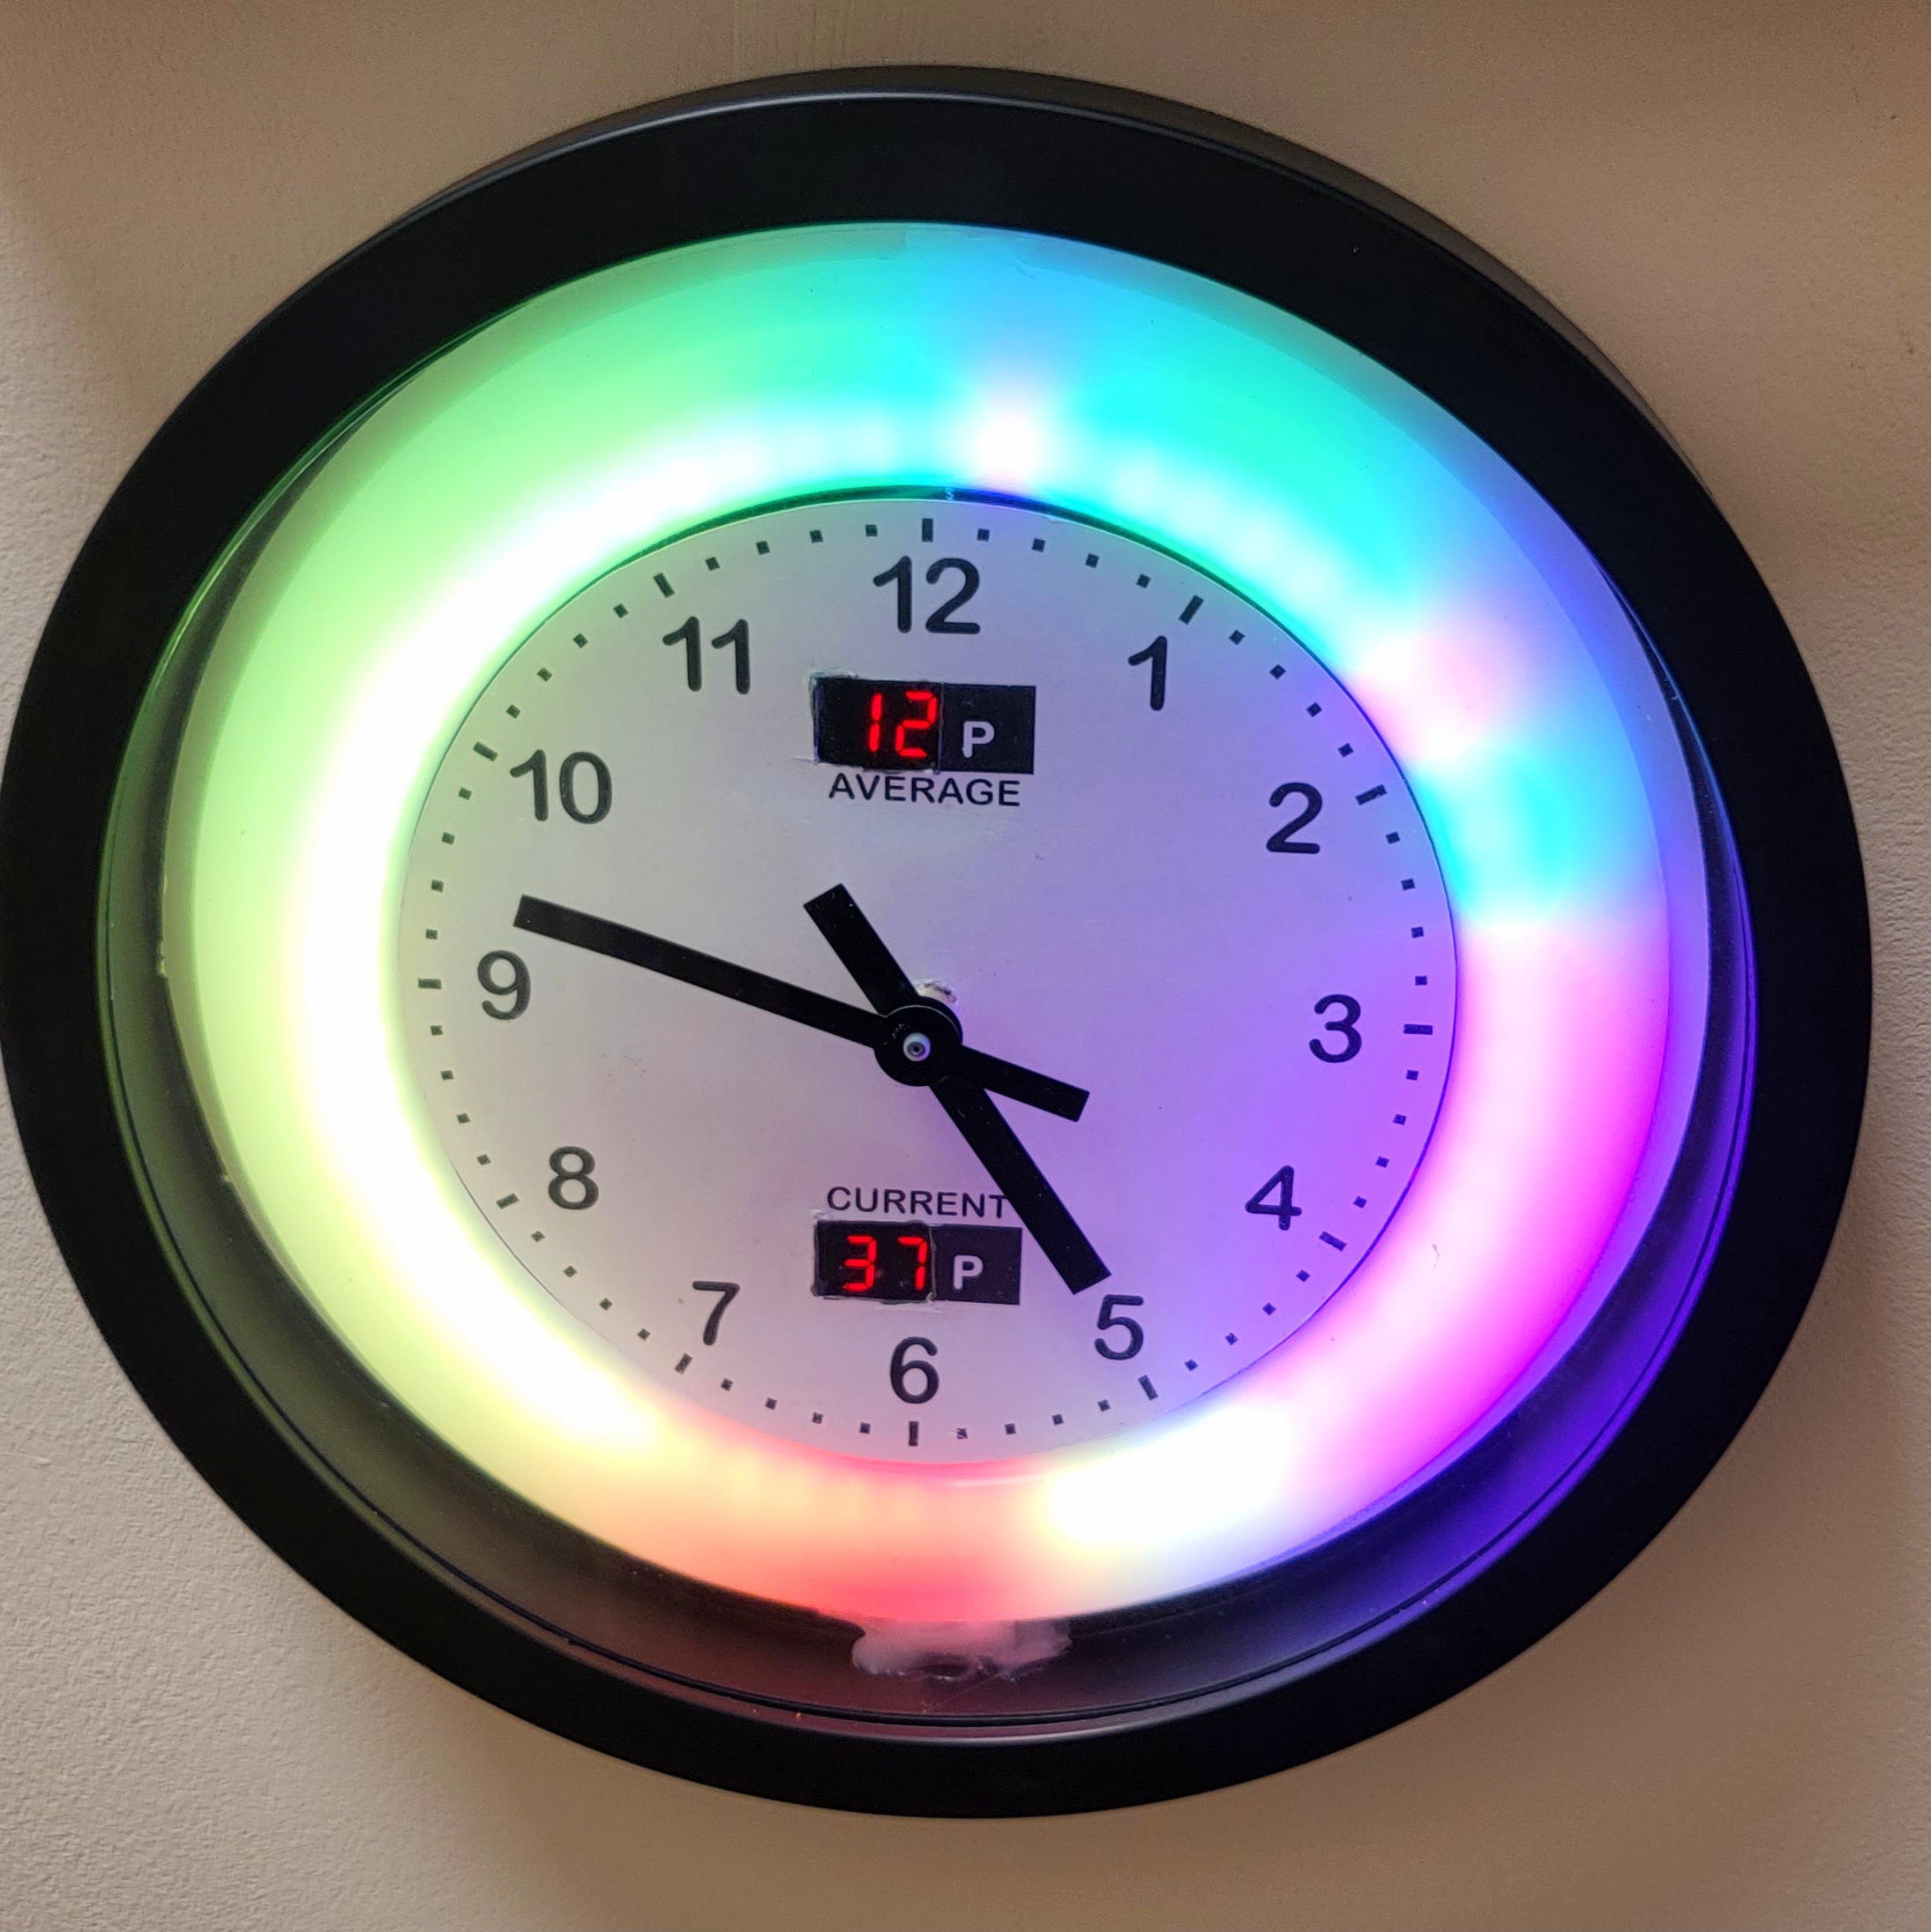
Since I live in an Octopus Power Ups area, I need to setup a calendar appointment in my Google calendar to activate the purple area during power up events since these special rates are not available in the Octopus API at present. For normal agile sub-zero events, the purple banding is automatic.
On the hardware side of things, I use a TinyPico ESP32 as a controller, a NeoPixel 60 ring for the led surround and two TM1637 7 segment displays to show the current and average rates. The hour and minute hands are driven by a regular clock mechanism - a useful way to check that the ring and actual times are in sync.
Arduino and Python code, as well as Fritzing schematics to build everything above yourself are available at https://github.com/shakso/EnergyMonitor/
 Darian Johnson
 Rohit Gujarathi
 James Hutchby - MadLab
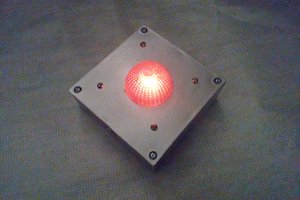
 Vishnu Mohanan