Leonardo
What's this?
Welcome to my project, Polyphemus.
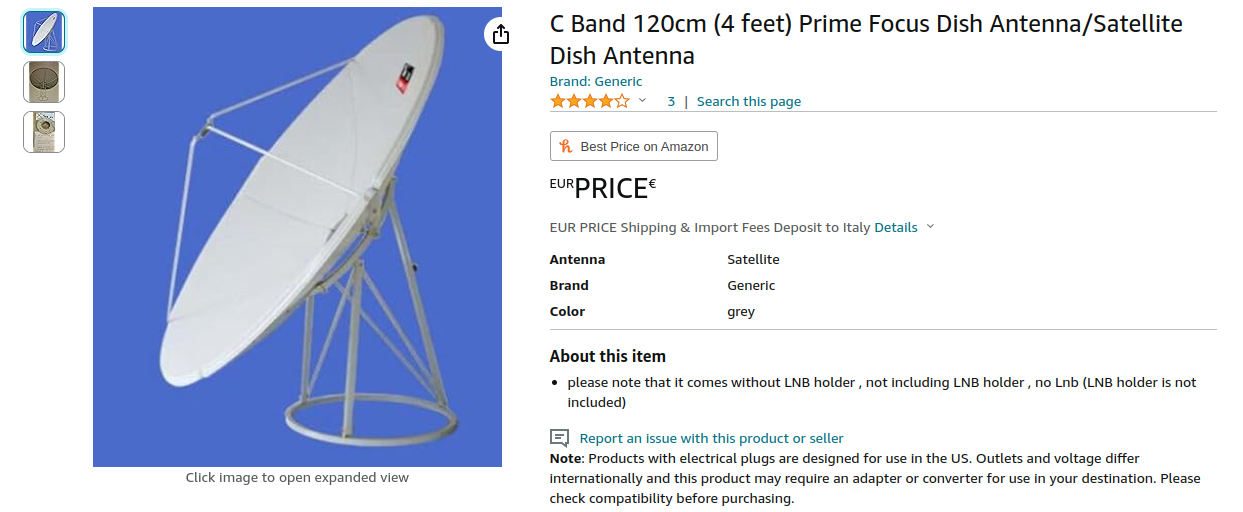
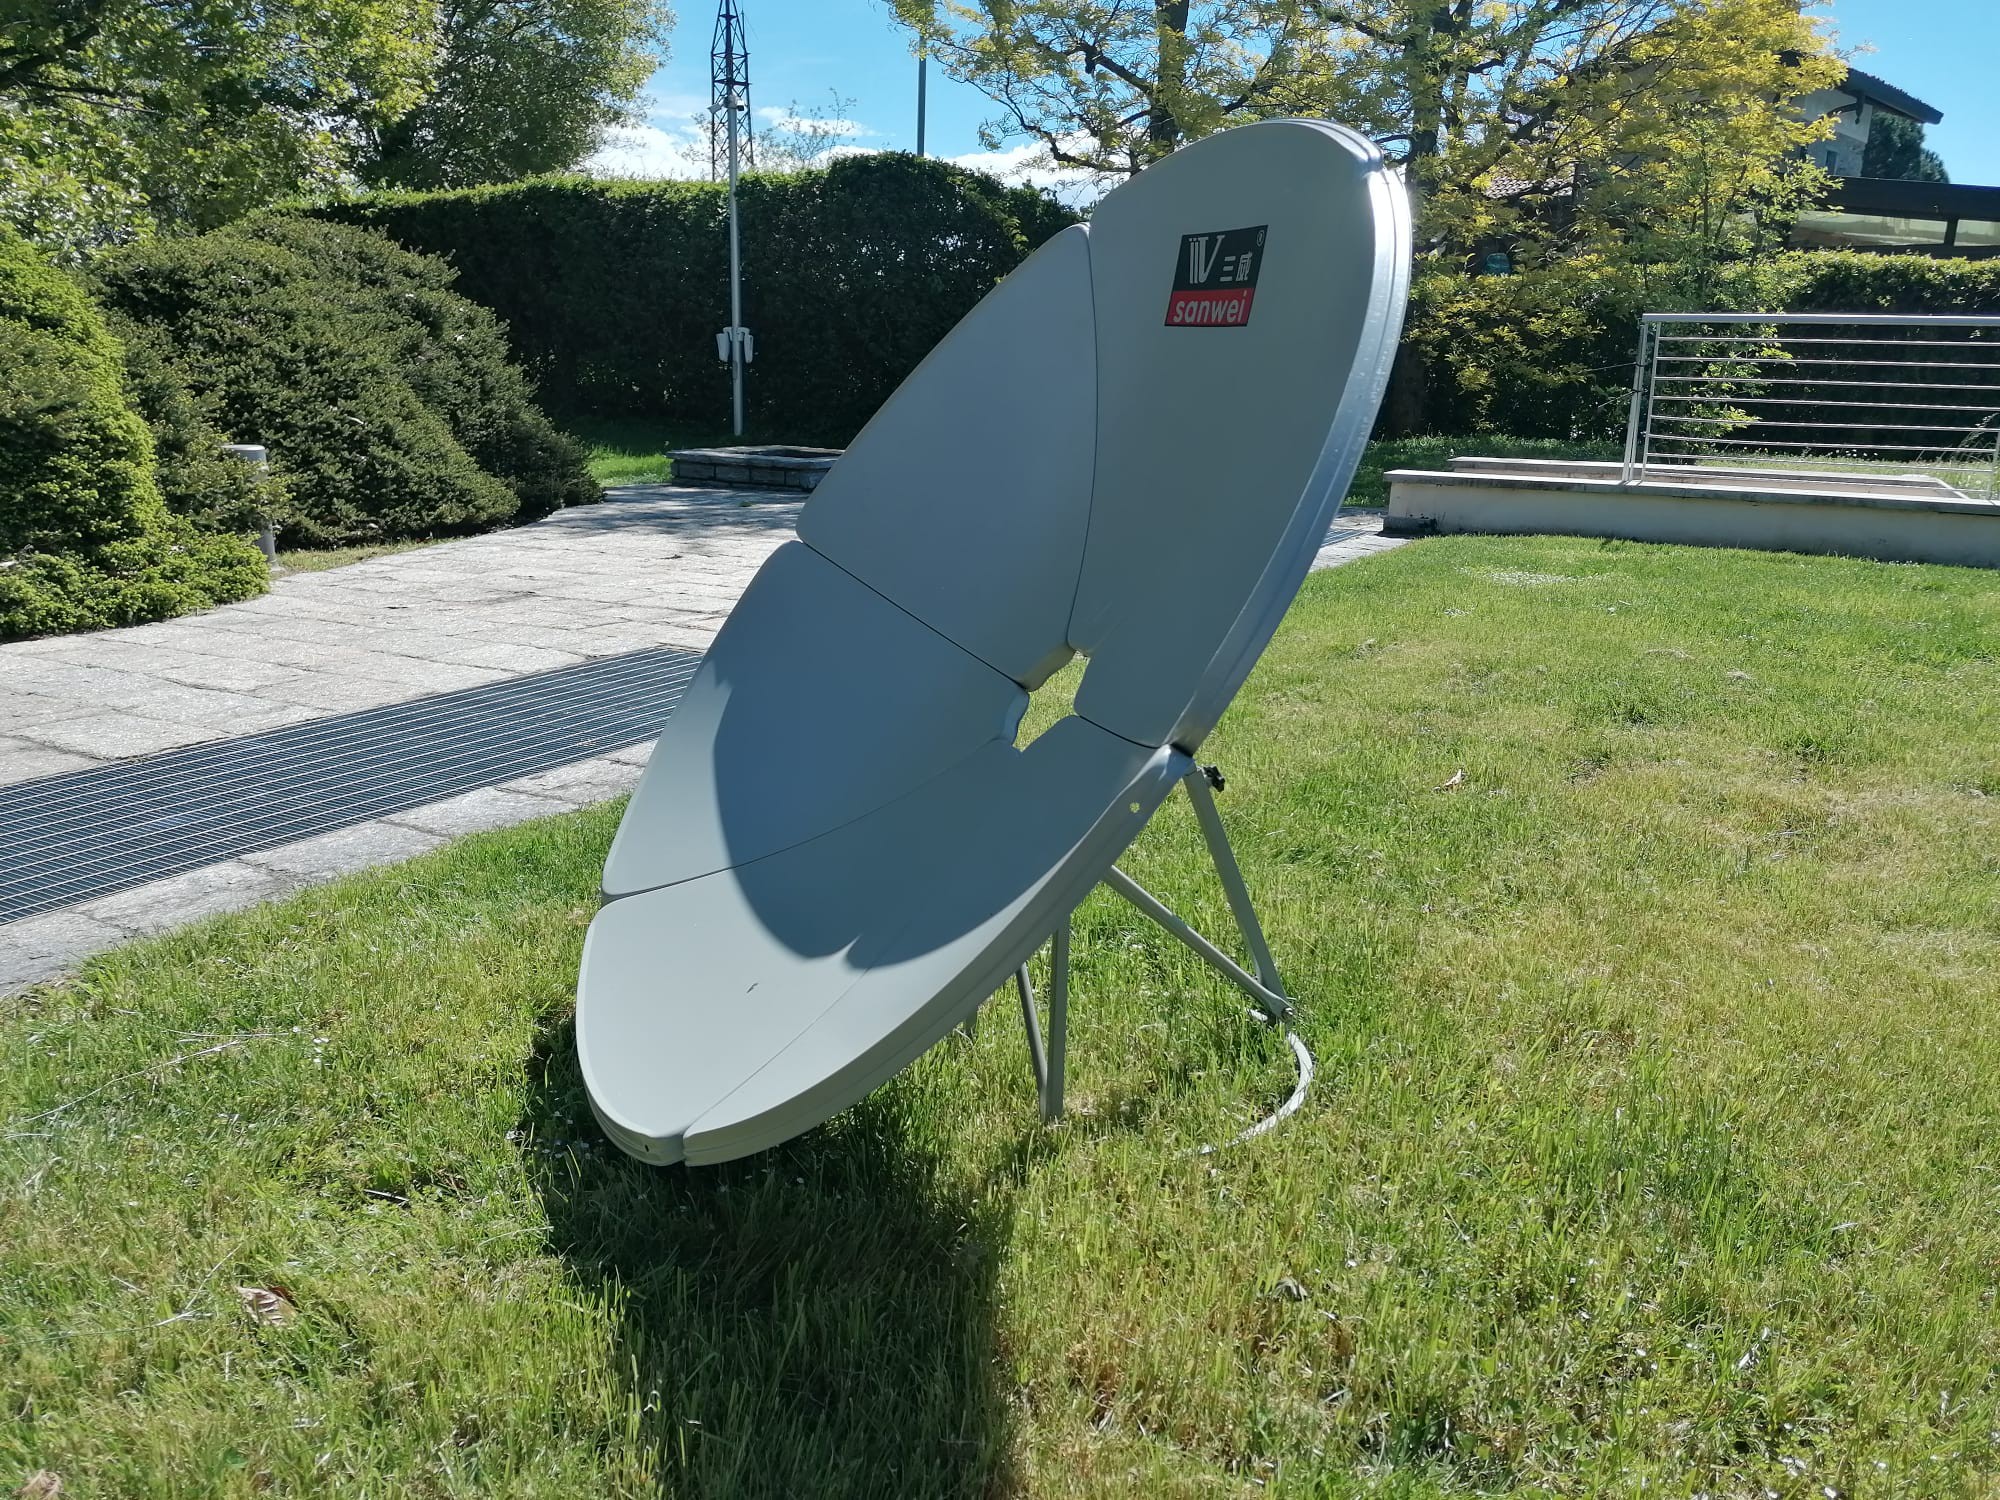
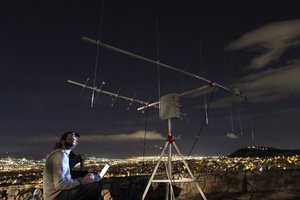
As you might guess by the title, here I publish all advancements made while building my radio telescope, a device scientists use to study the Universe in a different spectrum than the visible one.
For example, the most common use for this instrument is to get signals and data on the presence of hydrogen atoms in the Milky Way, our home galaxy.
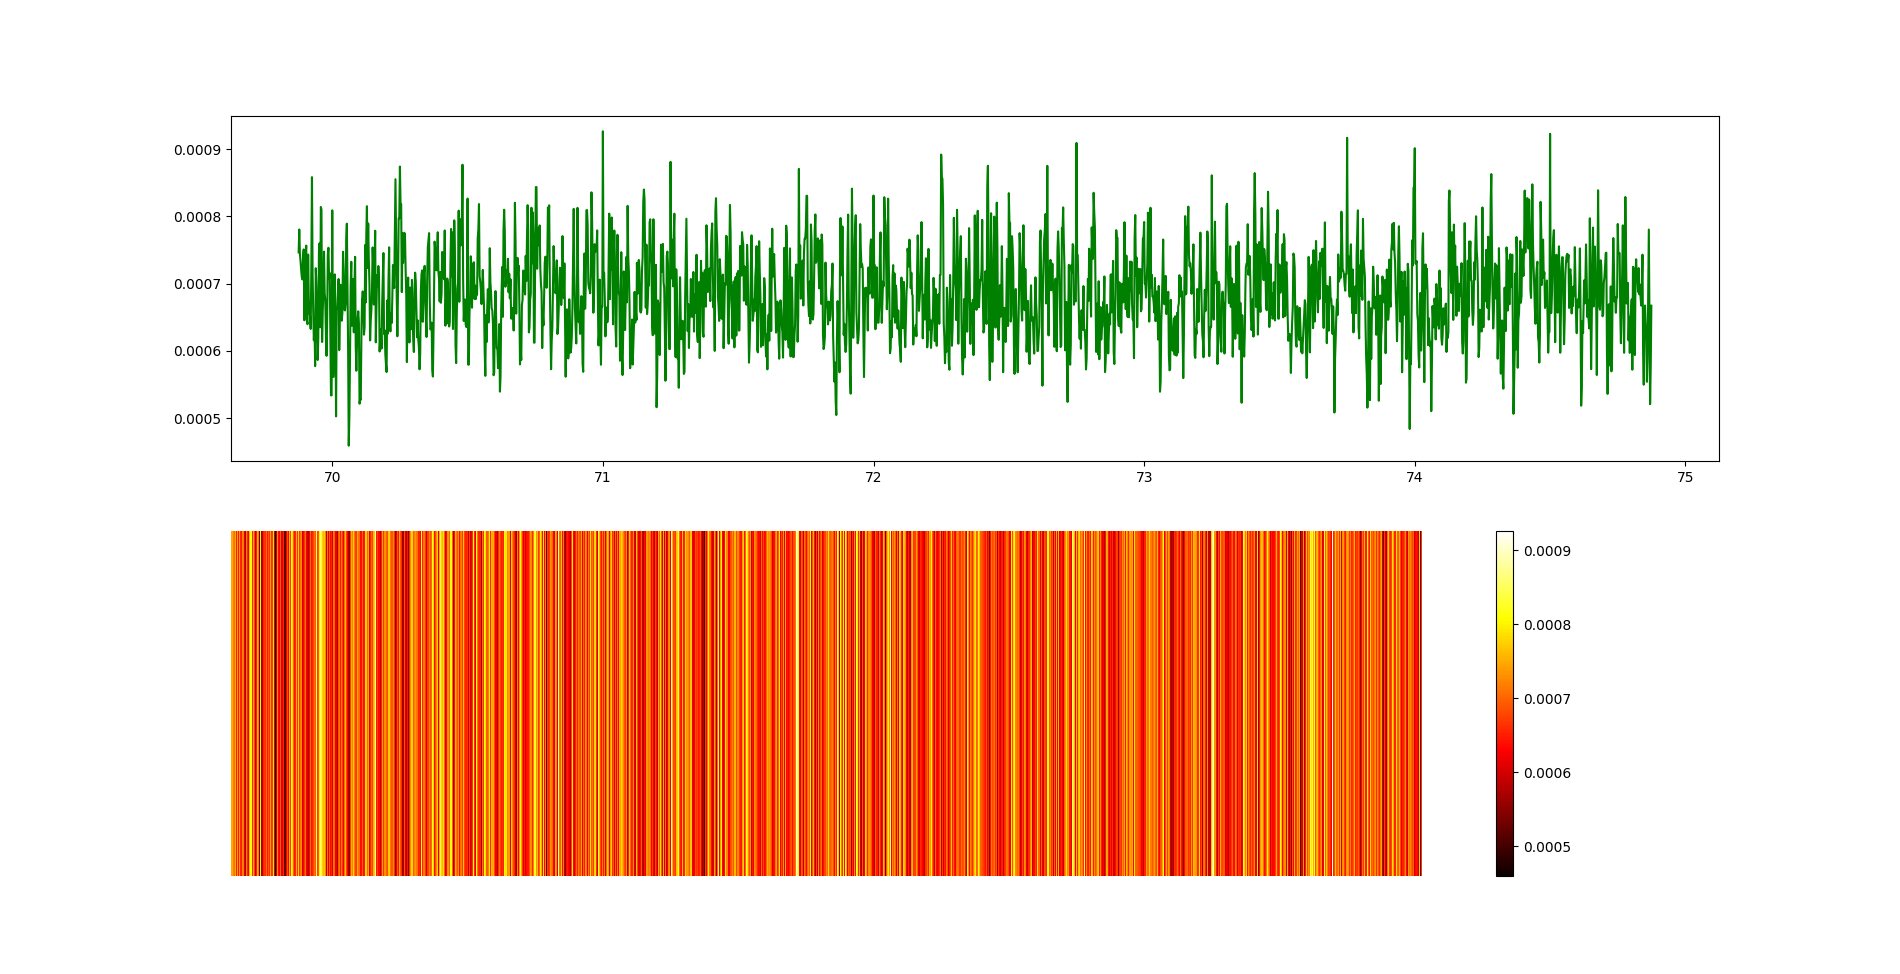
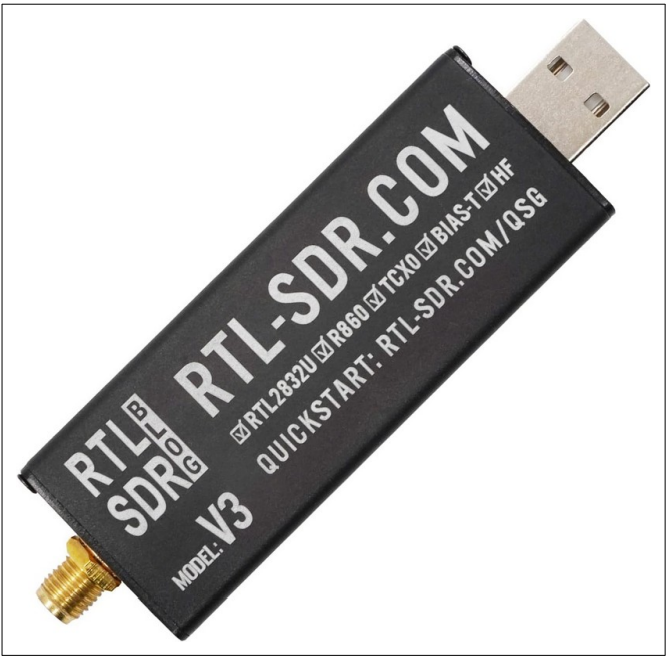
This is possible because those atoms can emit a particular radiation at a frequency of about 1420MHz, which my telescope can capture and process.
Why?
First of all, I've been passionate about physics, engineering and astronomy since childhood and taking on engineering/scientific challenges has always been a great way for me to learn new things.
Secondly, I've been using my regular Newtonian telescope for a couple of years now, and the feeling you get when looking at the universe is just amazing. So, why not try to take another look, but in a different way?
This idea does not just come from nothing... Lately, I've read this really interesting paper called "Basics of Radio Astronomy for the Goldstone-Apple Valley Radio Telescope" from NASA dated April 1998, where lots of physics behind radio telescopes is explained.
These factors made me think I could build such a thing... so I started!
 Pierros Papadeas
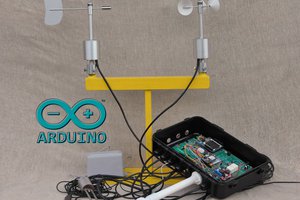
 Capt. Flatus O'Flaherty ☠