Close
0%
0%

SerialPlot - Realtime Plotting Software

Small and simple software for plotting data from serial port

Similar projects worth following
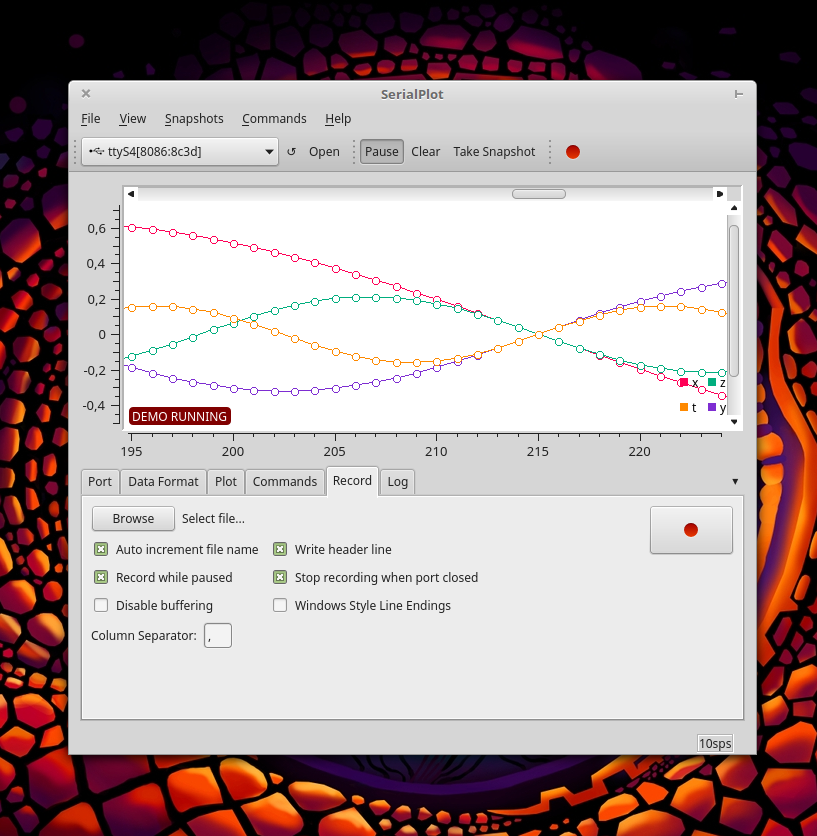
This is a Qt based software for plotting data from serial port in real time.

IMPORTANT: instead of commenting please consider creating a ticket at issue tracker (https://todo.sr.ht/~hyozd/serialplot or https://github.com/hyOzd/serialplot/issues) Hackaday's notification system is broken and I may not notice your messages.

SerialPlot accepts 3 different types of data input:

  • simple binary stream, supports different number formats (unsigned/signed - 8/16/32 bits and float)
  • ASCII data in CSV format
  • user defined custom frame format (frame start byte, frame size, checksum etc..)

You can take snapshots of current view and store them in CSV files. You can also load them back from csv files, for convenient viewing.User can also define "commands" to be sent to the serial port device with a click. Commands can be defined in HEX or ASCII format.

In the sidebar you can find links to Linux and Windows downloads and source code.
  • Moving Project to Git/Github (?)

    Hasan Yavuz Özderya05/31/2021 at 20:11 1 comment

    I'm considering moving this project to git. There has been a few requests. Not many. But I feel like reason is that people just don't request such things unless a project is really really popular. Actually there has been a git repository at github for quite some time. But I did not update it. I only kept it for visibility and as another place for people to create tickets.

    From now on; I will keep github repository up to date which is at: https://github.com/hyOzd/serialplot

    I enjoy using mercurial even though I don't have much opportunity to do so. For a while I will keep using both git and mercurial. There is a mercurial extension called hggit that makes this relatively easy and pain free. For git users there should be no drawbacks.

    To be honest if git repository turns into something popular I will probably stop using mercurial altogether.

  • SerialPlot v0.12 release

    Hasan Yavuz Özderya05/14/2021 at 16:19 3 comments

    This is another minor release. There isn't any significant changes.

    Changes:

    • Filter by prefix for ASCII data format parser (thanks to Alexander Amelkin)
      This is useful when your data is mixed with other information such as log messages. There is no way of displaying such log messages on SerialPlot yet.
    • Export SVG (thanks to martijuerg)
    • Other minor fixes improvements etc:
      • remember user entered custom baud rate
      • add double precision floating point number format support for binary readers
      • fix 'settings invalid' error when loading config with 'first byte is size byte' enabled
      • fix for data format selection can be empty (no button is selected state which is invalid)

    As always you can find latest download links in the sidebar.

    Download links for v0.12:

    Windows installer: https://serialplot.ozderya.net/downloads/serialplot-0.12.0-win32-setup.exe

    Windows EXE 7Zip: https://serialplot.ozderya.net/downloads/serialplot-0.12.0-win32.7z

    Windows EXE: https://serialplot.ozderya.net/downloads/serialplot-0.12.0-win32.exe

    Linux AppImage (based on Ubuntu 18.04): https://serialplot.ozderya.net/downloads/serialplot-0.12.0-x86_64.AppImage

  • SerialPlot v0.11 release

    Hasan Yavuz Özderya09/14/2020 at 11:12 1 comment

    Well, it's been a while.

    But I decided to finally put together a new release. There aren't any big news or changes. To be honest what pushed me to finally create a new release is that I forgot to move the "downloads' section from the bitbucket before they axed the mercurial repositories and as a result got a lot of mails/comments from people around to world. Sorry.

    Here are some changes that come in v0.11:

    • command line options thanks to Mehmet Aslan
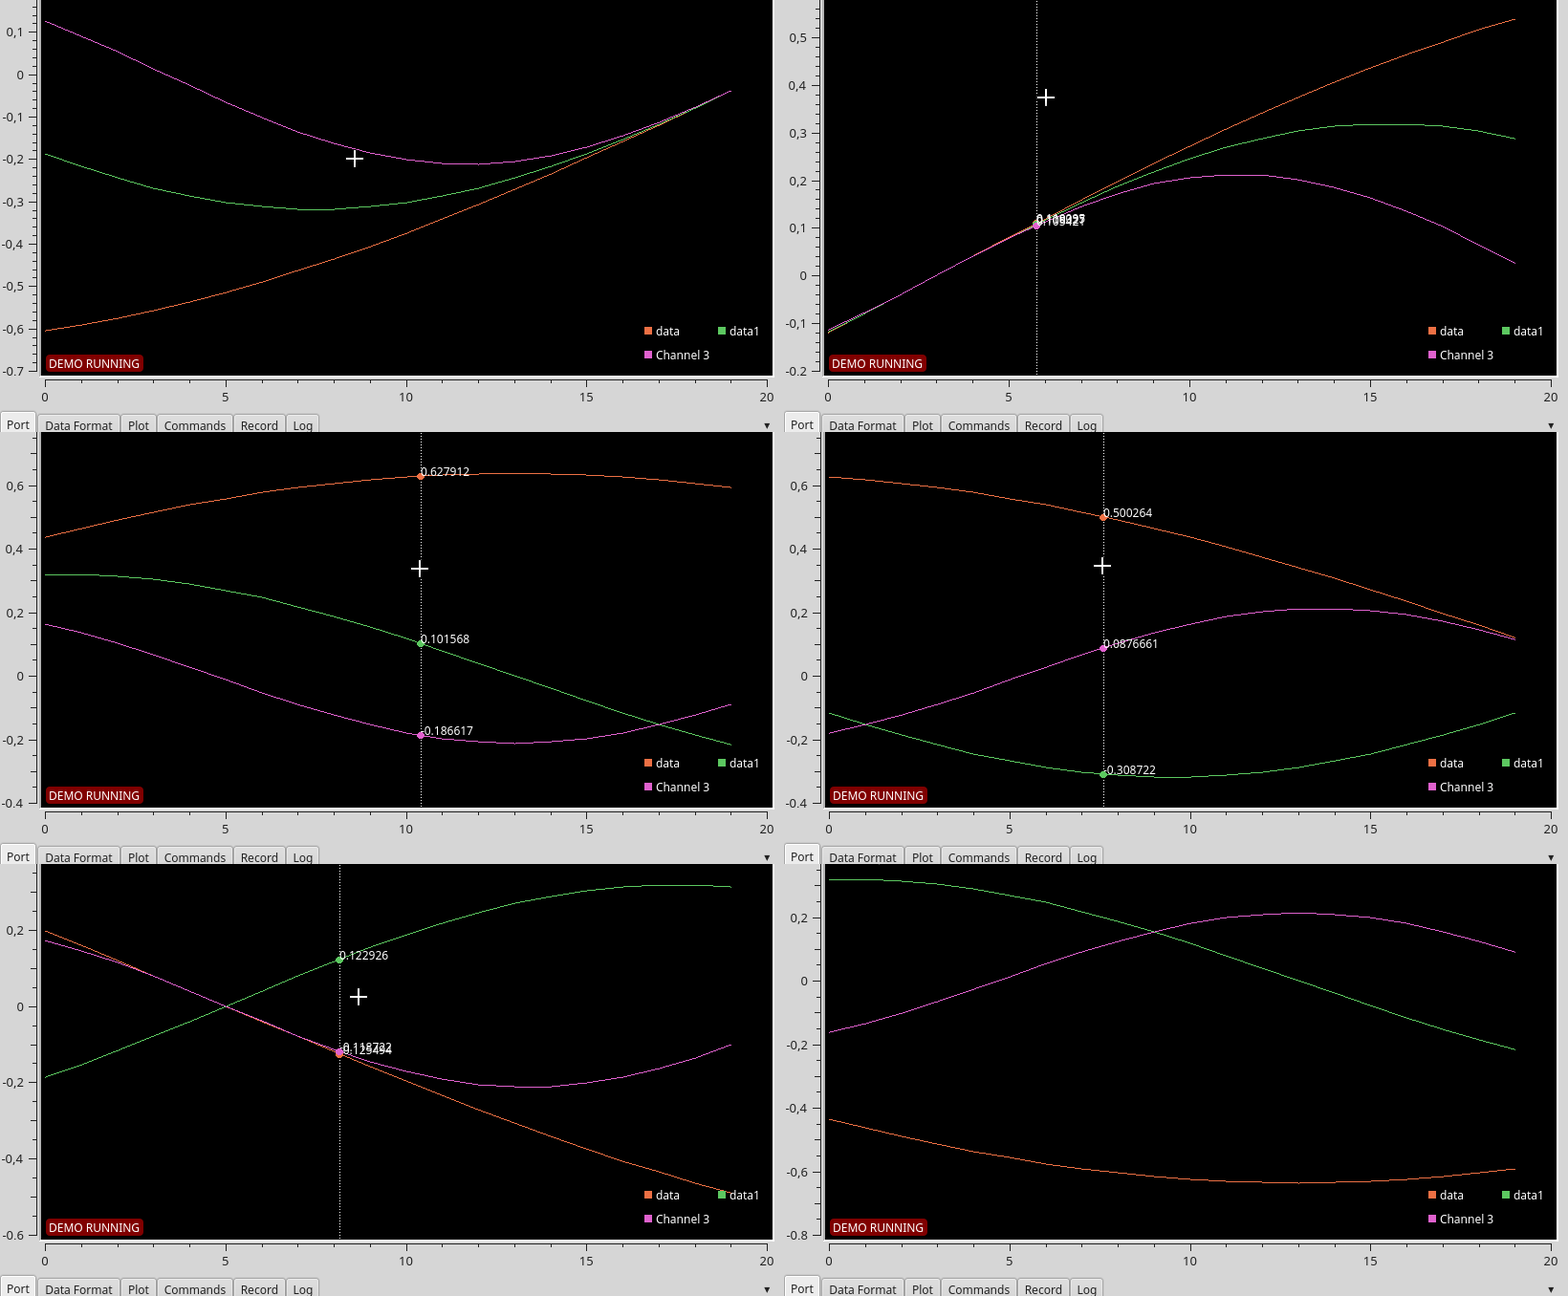
    • "value tracker" that displays the sample values under cursor
    • "Text View" panel to display read values
    • Gain and Offset to adjust input data
    • An experimental "Bar Plot" widget
    • added icons for Windows
    • recorder timestamp format
    • decimal precision setting for recorder
    • port read statistics
    • many fixes

    Download links:

    Linux AppImage (Ubuntu Trusty based, should work on anything newer):

    https://serialplot.ozderya.net/downloads/serialplot-v0.11.0-x86_64.AppImage

    Windows 32 bit (should work fine on 64 bit windows):

    https://serialplot.ozderya.net/downloads/serialplot-0.11.0-win32.exe

    Important: I didn't have time to test either of these images. Please let me know if you have any problems with them.

  • Building SerialPlot for Windows using Docker

    Hasan Yavuz Özderya09/14/2020 at 11:02 0 comments

    Building serialplot on windows isn't much different than building on linux. But it isn't as straightforward. Installing dependencies can be difficult. And it is also difficult to build a static EXE that doesn't require DLLs to keep it company. But most importantly it is difficult for me, because I don't use windows other than for gaming purposes. Unfortunately most users of SerialPlot use windows and as a result I can't ignore it.

    Luckily there is MXE to my rescue. This is a cross compilation toolchain to build windows binaries (and more) on a linux (unix like) host. Whats more is that they also provide 'static' toolchains. When you build your project with a static toolchain it is easier to deploy and can be smaller in size.

    So I prepared a dockerfile to make it even easier to build windows using docker. You can build this docker image on linux. AFAIK there are ways to run docker on windows host but I won't go into any details of that. It is also possible to use MXE in msys2, which is a layer to run unix programs on windows. In fact most of the windows releases until now has been built on windows using msys2 and mxe.

    Dockerfile is already included in the serialplot source code called:

    Dockerfile_mxe

    Assuming you have already installed docker, download the serialplot source code using mercurial and build the docker image:

    hg clone https://hg.sr.ht/~hyozd/serialplot/
    cd serialplot
    sudo docker build -t serialplot_mxe -f Dockerfile_mxe ./

    Remember this might easily take a couple hours depending on your internet speed and cpu power. To give you an idea resulting docker image is around 5GB in size.

    If all goes well you can get the built binary from inside the docker image with this command:

    sudo docker run --rm --entrypoint cat serialplot_mxe /serialplot/build_docker_mxe/serialplot.exe > ../serialplot.exe 


  • How to build SerialPlot on Linux

    Hasan Yavuz Özderya09/07/2020 at 07:59 0 comments

    These are the steps for building SerialPlot on linux. I will also provide more detailed steps for Ubuntu and similar debian based distributions.

    Building SerialPlot on linux is quite easy. Most difficult part (not really difficult) is gathering the dependencies. It is possible that you already have some of them installed such as a C++ compiler.

    I've also described how to build with docker which might be the easiest method if you are familiar with it.

    Install Dependencies

    You should have following dependencies installed, preferably using your package manager:

    • Qt5 Development Package (at least version 5.9; recommended 5.15)
    • Qt5 serialport and svg package
    • Cmake (version 3.x)
    • C++ compiler (somewhat new, should support C++11) and make (usually installed with a base package)
    • Mercurial (to download source code, optional)

    On ubuntu or similar operating systems you can install these dependencies with the  following command.

    sudo apt install build-essential qtbase5-dev libqt5serialport5-dev libqt5svg5-dev cmake mercurial

     Note: instead of 'qtbase5-dev' you can install 'qt5-default' package to make sure it is the default qt version.

    Also note: SerialPlot doesn't build with Qt4, you need Qt5.

    Also also note: you need internet access during build process. It is not necessary, but if you don't, you have to also have "Qwt" library installed.

    Get Source Code

    You can download the source code using mercurial with the following command. Mercurial is a version control tool very similar to git.

    hg clone https://hg.sr.ht/~hyozd/serialplot

    Or if you don't want to deal with the mercurial you can download the latest code from this link.

    https://hg.sr.ht/~hyozd/serialplot/archive/tip.tar.gz

    Build

    When you have everything ready, run following commands in the serialplot directory.

    mkdir build
    cmake ..
    make run

     This should build SerialPlot and start it.

    Building AppImage

    When you build SerialPlot this way it probably only works on your computer. It should work on other computers with the same distribution as yours as long as they have the correct libraries installed. If you want to lend your build to your friends you can create a portable executable called AppImage. This should run on most distributions. And it is how I release the Gnu/Linux version of the SerialPlot.

    It is easy to build SerialPlot appimage.

    Run below command in your build directory.

    cmake ..
    make appimage

    That's it. If everything goes well you should  now have SerialPlot appimage in your build directory, and it should run in most distributions (fingers crossed).

    Building with Docker

    There is a Dockerfile inside the serialplot directory ready to go. It is based on Ubuntu 18.04 (bionic) [used to be 14.04 (trusty)]. Building it, produces an appimage that you can use on Ubuntu/Debian based systems. Maybe on other distros too?

    If you don't have it installed, you can install docker on Ubuntu with this command:

    sudo apt install docker.io

    After that, get into the directory of 'serialplot' where the 'Dockerfile' exists and run this command. It might take some time depending on your internet speed.

    sudo docker build -t serialplot_bionic .

     This will build a docker image that should contain the SerialPlot appimage. After building appimage, you should get it from inside the docker image with this command.

    sudo docker run --rm --entrypoint cat serialplot_bionic /serialplot/build_docker/SerialPlot-x86_64.AppImage > ./serialplot.appimage

    Make it executable and start serialplot:

    chmod +x ./serialplot.appimage
    ./serialplot.appimage

    Notes

    Although actual build process is quite simple and straightforward, if you are not experienced you may have issues building SerialPlot successfully. It usually is missing dependencies. It rarely is an incompatible library. In that case please leave a comment : ) I will be happy to help.

    Also if you have steps for other distributions and recommendations, please share, I will...

    Read more »

  • Moving SerialPlot out of bitbucket

    Hasan Yavuz Özderya05/01/2020 at 10:15 4 comments

    Bitbucket is removing mercurial support along with all mercurial repositories.

    I decided to move the source code to sourcehut.

    Here is the mercurial repository: https://hg.sr.ht/~hyozd/serialplot/

    Here is the new issue tracker: https://todo.sr.ht/~hyozd/serialplot

    I haven't moved download files yet. I will probably have to host them myself. Sourcehut doesn't provide file hosting.

  • Sample value tracker development in progress

    Hasan Yavuz Özderya09/27/2018 at 21:11 2 comments

  • SerialPlot v0.10.0 Released

    Hasan Yavuz Özderya09/03/2017 at 15:19 0 comments

    SerialPlot 0.10 is released. This release brings some performance improvements, minor features and bug fixes.

    Instead of "number of samples" option in the "Plot" tab, now there are 2 options you can set. "Buffer Size" and "Plot Width". "Buffer Size" is the total number of samples that are kept in memory, while "Plot Width" is the maximum number of samples that are plotted at once, in X axis. To see previous samples you simply use the X axis scrollbar. The main reason for this distinction is the performance. Previously you couldn't set number of samples too high because SerialPlot tried to plot all data at one time. Now you can set "Buffer Size" to 1.000.000 and it will most likely will be fine as long as you keep "Plot Width" small. Another advantage is that, sometimes when you have frequently changing data, zooming way out doesn't mean much, you have too keep a certain zoom level in X axis to be able to see any detail. If you enjoy the old behaviour you can always set buffer size option same number as plot width and it should be fine. Remember though "plot width" option has a smaller limit then "buffer size" for performance reasons. A note; performance improvements are not done. I'm still working on some improvements to increase "buffer size" limitations.

    Now you can set RS232 control signals (DTR, RTS) and see input signal () statuses from the "Port" tab. Being able to set DTR signal was a requested feature so that SerialPlot can work with Arduino Leanardo board.

    Also we now have an update checker. You can launch it from the "Help" menu. It will check updates once a day when you first launch SerialPlot unless you disable it.

    Other improvements and bug fixes:

    • custom ASCII (csv) data column delimiter
    • fixed snapshot display bug
    • fixed command type not loaded/remembered
    • fixed duplicated channel names

    Check the sidebar for download links. I will try update the win32 version and launchpad PPA later this week.

  • Patch Release 0.9.1

    Hasan Yavuz Özderya05/05/2017 at 12:25 6 comments

    This patch fixes various issues and adds small improvements:

    • fix symbols getting stuck after multiplot mode
    • fix symbols in snapshot view
    • add options to disable (or always enable) symbols
    • panning (Ctrl+Left Mouse) @Maxim
    • show snapshot view in current plot settings
    • fix snapshot view axis stuck at [0-1]

    See downloads links at the sidebar.

  • SerialPlot 0.9 Released (Recording and Scrollbars)

    Hasan Yavuz Özderya04/17/2017 at 12:55 3 comments

    Hi everyone, it's release time. First of all I want to thank everyone who contacted me via various channels for their kind comments! And ideas of course... some to be implemented... some day... : )

    Changes:

    • scrollbars for plot (appears when zoomed)
    • continuous recording to CSV file
    • channels can be hidden and plot colors are adjustable ("Plot" tab)
    • bunch of various GUI improvements and minor bug fixes

    Installation for linux:

    PPA for Ubuntu 16.04 (xenial) and based distros: https://launchpad.net/~hyozd/+archive/ubuntu/serialplot

    Appimage(*) for other distros: https://bitbucket.org/hyOzd/serialplot/downloads/SerialPlot-x86_64.AppImage

    Installation for windows:

    64bit setup: https://bitbucket.org/hyOzd/serialplot/downloads/serialplot-0.9.0-win64.exe

    32bit setup: https://bitbucket.org/hyOzd/serialplot/downloads/serialplot-0.9.0-win32.exe

    (*) Appimage may be broken on some systems. Please let me know if you have any problems.

View all 18 project logs

Enjoy this project?

Share

Discussions

Waleed El-Badry wrote 04/03/2020 at 01:09 point

Hello,
May I know how do you parse the incoming serial data using custom frame?

It is amazing that even if the stream starts not in sync, it is syncing and plotting data. I would appreciate if I can get the code snippet you created for this. Thanks

  Are you sure? yes | no

Hasan Yavuz Özderya wrote 04/03/2020 at 10:24 point

https://hg.sr.ht/~hyozd/serialplot/browse/default/src/framedreader.cpp#L196

This is the logic that reads framed data.

`readData` method is called whenever new data is available on the port. Complete frame may not be avilable yet. But we try to read as many bytes as possible. We don't read all available bytes. We read it if we can use it.

There are some important member variables that keep the current state of the reader. First of all we have to wait for a 'sync' byte/sequence. For this there is `gotSync` variable. If it's not true; we try to read the sync sequence. If we are successful we set the `gotSync` true. And this makes the loop to continue on other steps. When a frame is completely read we set `gotSync` to false, to indicate we should start looking for a sync sequence again.

`hasSizeByte` holds the setting for 'first size of payload is size' option. That makes `gotSize` state variable relevant. After reading sync sequence, this variable should be false. So we try to read size of frame. If it is successful we set the `gotSize` true and continue reading rest of the frame.

Well if have sync sequence (gotSync) and if we have size information (gotSize) we can read the payload of the frame. But we only read if all of the frame payload available (this could be improved actually). `readFrameDataAndCheck` is the actual function that reads the payload and runs the checksum (if it is enabled). Completely read data is sent out to other modules of the program with `feedOut(samples);` line.

When all frame is read, we call `reset()` function to set all state variables to initial values such as `gotSync` and `gotSize`  to start reading a new frame.

I hope this was helpful.

  Are you sure? yes | no

jarekgol wrote 03/31/2020 at 17:09 point

Hi! Nice program. Can I clear screen from keyboard / mouse?

  Are you sure? yes | no

Hasan Yavuz Özderya wrote 09/06/2020 at 21:04 point

Ctrl-K should work.

  Are you sure? yes | no

Priit Humal wrote 02/27/2020 at 17:35 point

Hi Hazan,

congrats for extremely useful software with nice features. I tried to build with Qt 5.14.1. using MinGW in W10, but got about 40 warning messages in compilation and although finally the release was able to run it crashed after few minutes. Probably some incompatibility issues. Could you update PPA?  Or provide any hint for simplest building? Thank you!

  Are you sure? yes | no

manojent wrote 02/13/2020 at 10:12 point

Hi Mr Hasan. 

Cheers for a wonderful software, but I am facing some issues. Initially I had installed it on a Windows 7 laptop and it worked like a charm. Then I used it on a Windows 10 laptop, wherein I had to tinker with the compatibility before it ran and again works well on it.

Very recently, I upgraded my Windows 7 machine to Windows 8.1, but the software just refuses to run. I have tried all that I could within my limited understanding of the subject, but am just unable to make it run on Windows 8.1. Everytime I open the software, it runs and then within a few seconds, it closes. 

When I install the older version available of the software, which is 0.9.0.0, it runs, but then that has some inherent shortcomings and bugs.

Do you think, you could help me with it?

However, it would be prudent to mention, that I am a medical doctor, who tinkers with these things and other such electronic platforms, only as a hobby. Since that would limit the fact that I could tinker with the source code.

Thanking you in anticipation.

  Are you sure? yes | no

Vishal Dhayalan wrote 02/10/2020 at 23:44 point

When CSV data (originally produced through SerialPlot) is loaded back as a snapshot, not all of the data is shown, only first 650 points or so are shown and the rest is blank even though the CSV file itself has values beyond this... I can't seem to find any way of making it show all the data. What's the reason for this?

  Are you sure? yes | no

Hasan Yavuz Özderya wrote 02/11/2020 at 08:15 point

@Vishal Dhayalan this bug should be fixed. Unfortunately fix is not part of the latest released version (which is quite old to be honest). You will have to compile from source to have the fix.

  Are you sure? yes | no

Vishal Dhayalan wrote 02/11/2020 at 08:21 point

Oh ok, how do I compile from source (on a Windows machine)? I've seen the source on bitbucket, but are there any instructions for compiling from source? Thanks.

  Are you sure? yes | no

Hasan Yavuz Özderya wrote 02/11/2020 at 18:47 point

I'm afraid I don't have instructions for windows build atm.

  Are you sure? yes | no

elpidiovaldez wrote 01/24/2020 at 04:55 point

The data in the text view is not in the order that I send it in the frame.  The channel numbers do not seem to relate to this order either.  I find it very difficult to work out which channel my variables appear on.  I am probably doing something wrong somewhere but after hours staring at it I can't find the cause.

I can't see why the channels would not be in the order the data is sent., but are they ?  If not how can I work out which variable appears on which channel ?

  Are you sure? yes | no

Hasan Yavuz Özderya wrote 01/24/2020 at 05:23 point

Which data format are you using? If you are using custom frame format, channel order is interleaved. For example In this diagram data type is int16 and number of channels is 2 : https://hasanyavuz.ozderya.net/wordpress/wp-content/uploads/customframe.svg

  Are you sure? yes | no

elpidiovaldez wrote 01/24/2020 at 21:07 point

Thank you for your fast response.  Although I am having difficulties, I love your program.  It seems simple yet very powerful.

I was using 'Simple Binary', 10 channels of 'float'.  I sent from an Arduino Nano using the following code (note on Nano sizeof(double)==4):

  void send() {
    Serial.write((byte *) &TargetSpeed,  sizeof(double));
    Serial.write((byte *) &Speed,            sizeof(double));
    Serial.write((byte *) &TargetTilt,        sizeof(double));
    Serial.write((byte *) &TiltInput,          sizeof(double));
    Serial.write((byte *) &TiltError,           sizeof(double));
    Serial.write((byte *) &TiltOutput,       sizeof(double));
    Serial.write((byte *) &LMotorSpeed, sizeof(double));
    Serial.write((byte *) &RMotorSpeed, sizeof(double));
    Serial.write((byte *) &LMotorPower,  sizeof(double));
    Serial.write((byte *) &RMotorPower,  sizeof(double));
  }

..., but I gave up on that and tried defining a custom frame..  At the start of 'send' I now send NaN, indicating start-of-frame as 4 bytes  (00 00 C0 7F).

My new settings are:

Frame Start: 00 00 C0 7F

# Channels: 10

Number Type: float

Fixed Size:  40

Little Endian

The data seems to be parsed correctly and appears in the correct order in the text view.  HOWEVER I now only get a single channel listed on the plot tab and cannot add more.

I tried for some time to get more channels listed and ONCE they actually appeared.  Then they disappeared on a subsequent trial.

I decided something might be corrupted in a settings file, so I deleted my .ini file.  Strangely the program still seemed to remember settings between runs.  Eventually I discovered a file, ~/.config/serialplot/serialplot.conf which contained settings.  I deleted this and the program started in a clean state.  I added my custom frame specification again, but I still only get 1 channel in the plot tab.  All channels are parsed correctly though, and can be seen in the data view.

I am really struggling with this.  I think there has to be some bug(s) in serialplot.

PS - I just found out why I once got the right number of channels for the custom frame ; If I save settings to a file (explicitly giving.ini as extension), then when I re-load the settings, I get the right number of channels.  This procedure is actually a temporary fix to my problems.

  Are you sure? yes | no

Hasan Yavuz Özderya wrote 01/25/2020 at 06:09 point

@elpidiovaldez This seems like a bug to me as well. Can you share your configuration files. Both the serialplots own configuration (but first close the application while problem is happening so that settings are saved) and the file you are saving using the File menu. BTW files should be in text format. You can review them to make sure they don't contain anything you don't want to share (they shouldn't but you should check anyway)

  Are you sure? yes | no

Hasan Yavuz Özderya wrote 01/25/2020 at 06:12 point

It seems like I can reproduce the problem.

  Are you sure? yes | no

Hasan Yavuz Özderya wrote 01/25/2020 at 06:13 point

A quicker workaround is this; after configuring settings in "Custom Frame" format switch to another format and switch back to custom frame format.

  Are you sure? yes | no

Hasan Yavuz Özderya wrote 01/25/2020 at 13:31 point

I think I found the problem, already pushed a fix.

  Are you sure? yes | no

elpidiovaldez wrote 01/25/2020 at 17:34 point

@Hasan  thank you again for amazingly quick support.  I am glad you found the problem.

I am already finding serialplot seriously useful.  Thanks for making it available.  

I have a few suggestions which might help improve your product.  I want to emphasise that I am not requesting these - just trying to give feedback as a user.

1) Apply channel gain and offset when you display the data (the plot AND the text view not, as it appears to be done, when the data is received.  This lets user re-scale multiple times to align traces AFTER the data is seen.  This is important if it is tedious/costly to capture data again. Maybe add  sliders so scale/offset can be adjusted and displayed interactively...

2)Add frame numbers to the text view, but make sure they are not selected when using cut/copy.

3) I find the definable 'commands' very useful.  It would also be quite useful to provide a command line input (like a terminal) where text can be entered and sent directly to port.  Maybe provide options for how newline, carriage return etc are sent.  This would allow direct interaction with a process that expects a terminal to be connected.  It is more flexible than a static command if you want to send new parameters.  Sadly the process cannot send text to serialplot as it would get mixed with the plot data.  Maybe you could define another frame type which contains a text string - however it would require modifying the attached program, so use is more limited.

4) Allow input from pipes and files etc, not just serial ports.  This expands the uses considerably (maybe this is already possible, but I could not find how).  I came upon 'socat' and used that, but you could probably make the functionality easier to use.

5)  Capture seems to stop after a while (buffer full ?).  It would help to toggle between this mode and continuous capture (using FIFO buffer ?).

  Are you sure? yes | no

Hasan Yavuz Özderya wrote 01/28/2020 at 08:59 point

@elpidiovaldez thanks for your suggestions. #5 sounds like a bug. Can you provide more information?

  Are you sure? yes | no

elpidiovaldez wrote 01/30/2020 at 23:20 point

I looked into num 5.  I still can't reproduce it reliably,  and I suspect the bug may be in my code.  One strange thing is that when the plots stop moving left, it is sometimes possible to restart them by pressing the little 'x' (by the pause button), to clear the buffer.

  Are you sure? yes | no

llltom007 wrote 08/11/2019 at 16:31 point

Is anyone able to use the data tracker demonstrated in https://hackaday.io/project/5334/logs. I found no instructions in SerialPlot v0.10.0 on how to realize that. I don't know what to do.

  Are you sure? yes | no

Hasan Yavuz Özderya wrote 10/11/2019 at 13:42 point

Sorry for late reply. That feature is complete. But you must compile from source code to have it. Unfortunately I haven't been able to do a new release. Mostly because building windows packages is a pain for me.

  Are you sure? yes | no

jamie.harvey.jr wrote 05/30/2019 at 17:08 point

IS there a way to have it plot from left to right? It appears to only fills the screen from right to left. It would be helpful to watch the data accumulate on the screen from an anchored left starting point.

  Are you sure? yes | no

clplaneguy wrote 05/02/2019 at 12:00 point

Has anyone seen this in SerialPlot.  It is a SerialPlot issue.  Perhaps it is related to a baud rate of 115200.  It seems as though SerialPlot is dropping a frame.  When it does this, ALL values are plotted as if they are set to zero.  This is in CSV form.  If I print a constant even it will plot as zero.  

Arduino IDE (Serial Plotter) - Thank You!:neutral_face:
SerialPlot - Thank You!:slightly_smiling_face:
Processing IDE Plotter - Thank You!:heart_eyes:
But my balancing robot program still needs more diagnostics. The plots are a big help. But a plot is different from a text log. A log can be helpful too. Both a log and a plot provide useful information, but they are different and the information that each provides is unique. So, I am trying to do both. My goal is to be able to look at a graph to find a point to inspect and check the log to see what happened. The problem is that all of this is coming through one serial port. I can run one terminal program or one plotting program. But if I use a terminal program, there no plot. If I use a plotting program, it is text intolerant. If my program uses Println, SerialPlot shuts down. The Processing Listener is more robust in that it does not shutdown. But it also refuses to make the plot. If I had both the log and a plot, I could sync them with the program time [millis()].

Is there any way to do this?

  Are you sure? yes | no

Hasan Yavuz Özderya wrote 05/03/2019 at 12:07 point

I have an idea to add 'message printing' along with data but never had time for it. In windows you might try this software to split your data to multiple serialports: https://www.eltima.com/products/vspdxp/

I don't know if there is a software that can do the similar in linux, but I previously used a python script to separate the plot data and push it to serialplot via pseudo terminals. SerialPlot is okay with opening pseudo terminals which are very similar to virtual serial ports.

  Are you sure? yes | no

Hasan Yavuz Özderya wrote 05/03/2019 at 12:10 point

It seems all the useful features (port splitting for ex.) are in the pro version :S

  Are you sure? yes | no

Dan wrote 02/28/2019 at 02:20 point

Thanks for the program. I'm developing a rs232 load cell interface and I was wanting to plot the output to play with filtering and your program had me plotting the live output in less than a minute.


One feature I'd love to have is a FFT of the plot as well. You've basically made the UI of an oscilloscope here, you would gain a lot by copying the math and processing functions that most oscilloscopes come with these days.

  Are you sure? yes | no

lysergicenemy wrote 03/24/2019 at 10:37 point

For such purposes (FFT, XY plot, filtering, math on input data) i use export to .csv and open it in Digilent Waveforms or Matlab. ideally, I would like to see the functionality as in code composer studio graph window.

  Are you sure? yes | no

crenn6977 wrote 01/21/2019 at 00:09 point

Thanks for the program; extremely useful for visualising data quickly.

  Are you sure? yes | no

burhan güler wrote 01/16/2019 at 07:02 point

Hasan kardeşim tebrik ederim. Çok güzel ve kullanışlı. Kayıt yaparken yalnız  okunan değerler kaydediliyor.  oysa okunan değerin zamanını da kaydetmeliydi diye düşünüyorum. bu özellik programı daha kullanışlı hale getirecektir. ellerine sağlık.

  Are you sure? yes | no

Hasan Yavuz Özderya wrote 02/11/2019 at 09:01 point

@burhan güler uzun süredir planladığım bir özellik. Ancak projeye fazla zaman ayıramıyorum. Geçici olarak şunu önerebilirim: "record" sekmesinden yapılan kayıtlara "timestamp" sütunu ekleyebiliyorsunuz. Zaten çok uzun süren kayıtları dosyaya sürekli olarak kaydetmenizi de öneririm.

  Are you sure? yes | no

Est wrote 01/11/2019 at 14:45 point

Thank you for your program, very useful

  Are you sure? yes | no

Saeid wrote 11/24/2018 at 22:59 point

Hi Hasan and thanks for your great, useful and powerful job.

A feature that will be very useful if added,  is the XY Plotting of a pair of channels.

Also here is some suggestions for making this tool more perfect:

- Ability to plot XY mode with selected pair of input  channels.

- Ability to making tracks thick and thin.

- Ability to move mouse to points and showing point value. 

- Ability to resize each individual graph horizontally in single graph mode. 

- Ability to navigate graphs with mouse.  Zooming in and out with wheel,  moving zoomed graph with holding down wheel and moving mouse.

- Ability to auto connect to last selected port and start plotting, at software startup.

- Ability to set graph min/max limit for each graph individually in single graph mode.

- Ability to disable/enable the graph auto scrolling. This will be very handy when user wish to check some previous part of graph while data will continue to receiving, the graph auto scrolling can be disabled and can be enabled again.

And also i found a bug that the program will crash when loading a huge recorded and saved snapshot.

  Are you sure? yes | no

Hasan Yavuz Özderya wrote 11/26/2018 at 12:19 point

@Saeid  thanks for your comments.
1. planned, I could say its in progresses

2. long term planned

3. currently in progress, check out the latest log for a GIF of it working

4. I didn't understand this one?

5. wheel zoom long term planned, you can move zoomed graph with CTRL+left mouse

6. planned

7. I think you mean "multi plot" mode?

8. I plan to implement this after the XY plotting. But it's going to be difficult.

  Are you sure? yes | no

Hasan Yavuz Özderya wrote 11/26/2018 at 12:24 point

@Saeid  can you create a bug report here with a sample file: https://bitbucket.org/hyOzd/serialplot/issues

  Are you sure? yes | no

Simon Benoit wrote 11/22/2018 at 00:17 point

Hey great work! That reminds me of the project I upgraded not so long ago. If you can find some inspiration you can take a look at it !!

https://github.com/Eriobis/serial_port_plotter

  Are you sure? yes | no

Hasan Yavuz Özderya wrote 11/22/2018 at 08:41 point

Thanks @Simon Benoit  I should really add the text view for data : )

  Are you sure? yes | no

En wrote 11/17/2018 at 17:07 point

Hi, good job!  You can add more channel than 32 please? 

 thanks!

  Are you sure? yes | no

Hasan Yavuz Özderya wrote 11/22/2018 at 08:40 point

Sure.

  Are you sure? yes | no

usserr wrote 10/13/2018 at 14:42 point

Great app, lightweight, fast and feature-rich, thank you!

  Are you sure? yes | no

Diego Hamilton wrote 10/12/2018 at 14:14 point

Hello, @Hasan Yavuz Özderya

I'm running on Linux Mint 19 (Ubuntu Bionic based), and i cannot add your PPA. It displays the following error:

HTTP Error 404: Not Found
Cannot add PPA: ''This PPA does not support bionic''.

Thanks in advance!

  Are you sure? yes | no

Hasan Yavuz Özderya wrote 11/06/2018 at 12:51 point

PPA hasn't been updated for some time. Please use the AppImage version.

  Are you sure? yes | no

HC wrote 09/21/2018 at 05:58 point

Hello, 

I am trying to use the serial plot on Windows 10 using a FTDI connector. The FTDI shows up as port 13 in the serial plot. However, the data doesn't plot. 

Any recommendations?? 

  Are you sure? yes | no

HC wrote 09/21/2018 at 06:32 point

@Hasan Yavuz Özderya forgot to mention you. 

  Are you sure? yes | no

Hasan Yavuz Özderya wrote 09/24/2018 at 08:12 point

@HC It doesn't matter, notifications are shit on hackaday anyway. I have no idea why it wouldn't plot. SP works fine with USB serialports. Make sure your "data format" settings are correct. Check the "Log" tab for errors. If you continue having problems, please create an issue here https://bitbucket.org/hyOzd/serialplot/issues with your settings file (File->Save Settings).

  Are you sure? yes | no

Koen van Vliet wrote 06/25/2018 at 11:11 point

Great tool! I use it almost every day.

  Are you sure? yes | no

Similar Projects

Does this project spark your interest?

Become a member to follow this project and never miss any updates