 Ahmed Oyenuga
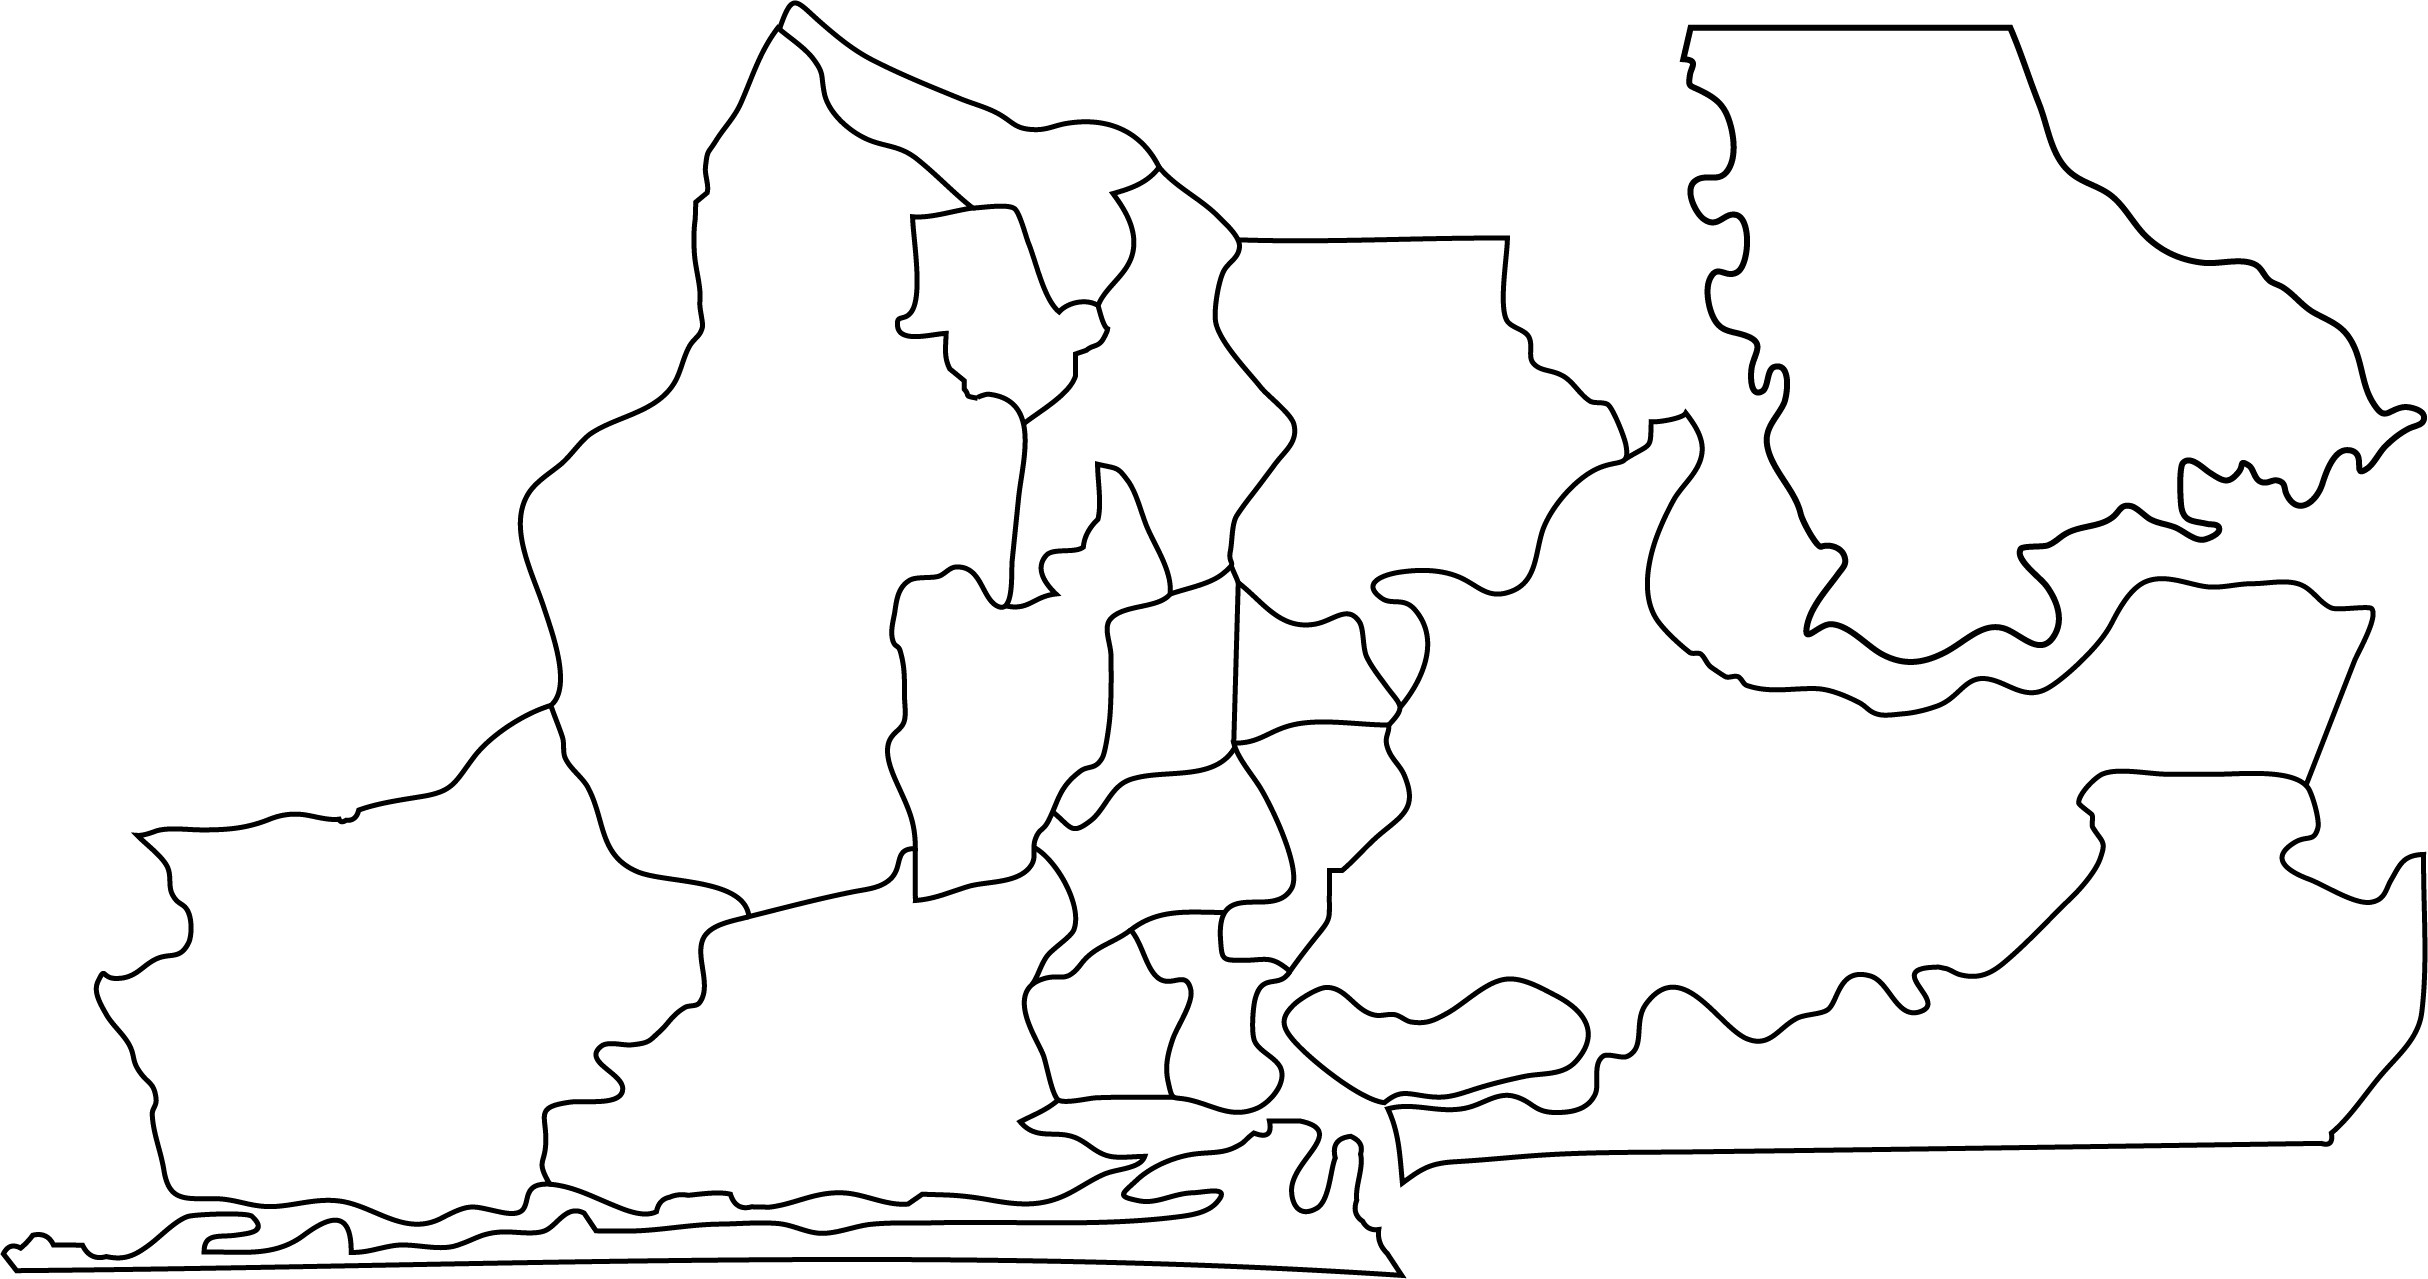
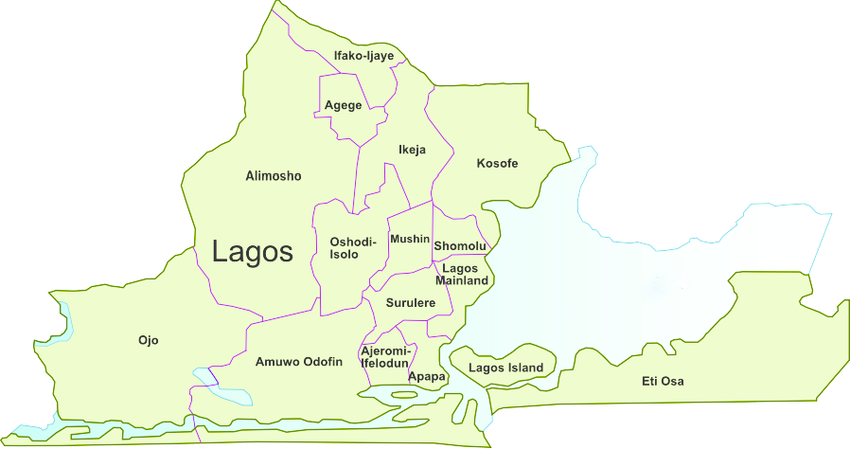
Just as you’ll use google maps on your phone to find locations and plan your route, the air quality map is a physical and interactive map that shows an area in terms of its air quality.
The air quality map shows you using discrete led colors, the air quality of specific areas as you move your hands across the map, so you can maybe plan a different route, make sure to wear protective masks, or altogether avoid the area if you can.
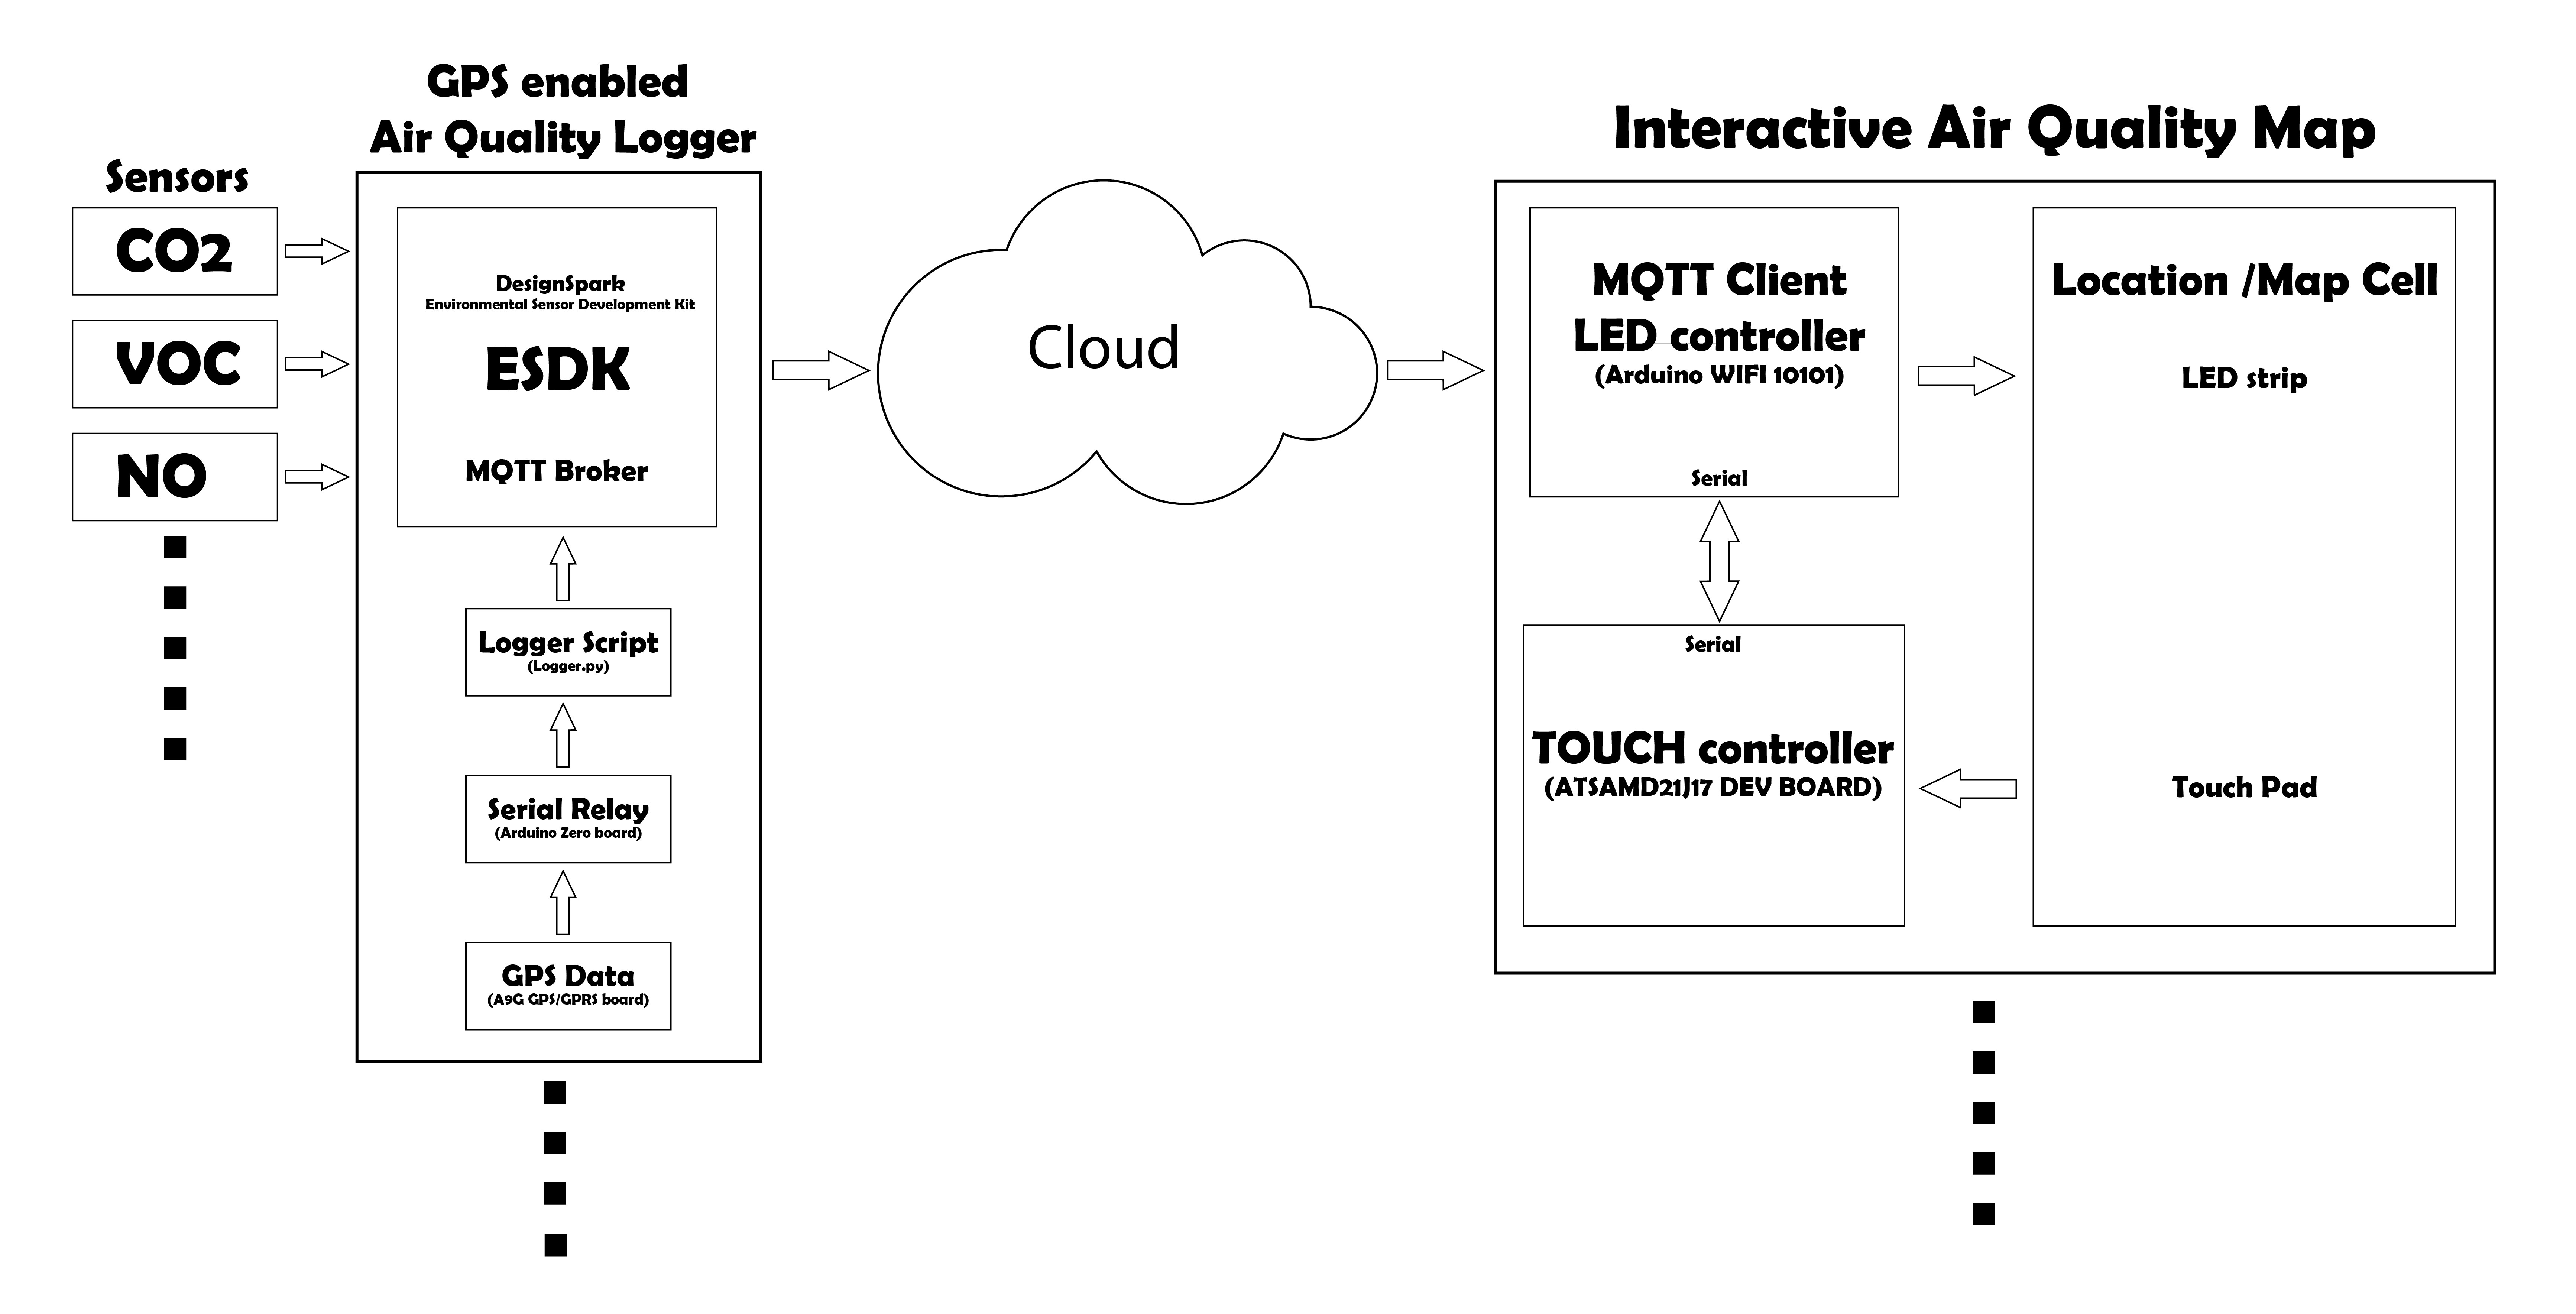
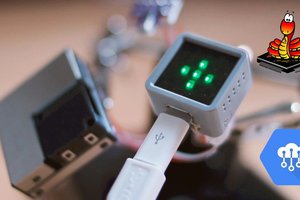
Each of the locations represented on the map is treated as a cell, and each cell features a proximity sensor for detecting human interactions, and an array of individually addressable LEDs to show the air quality levels as colors.
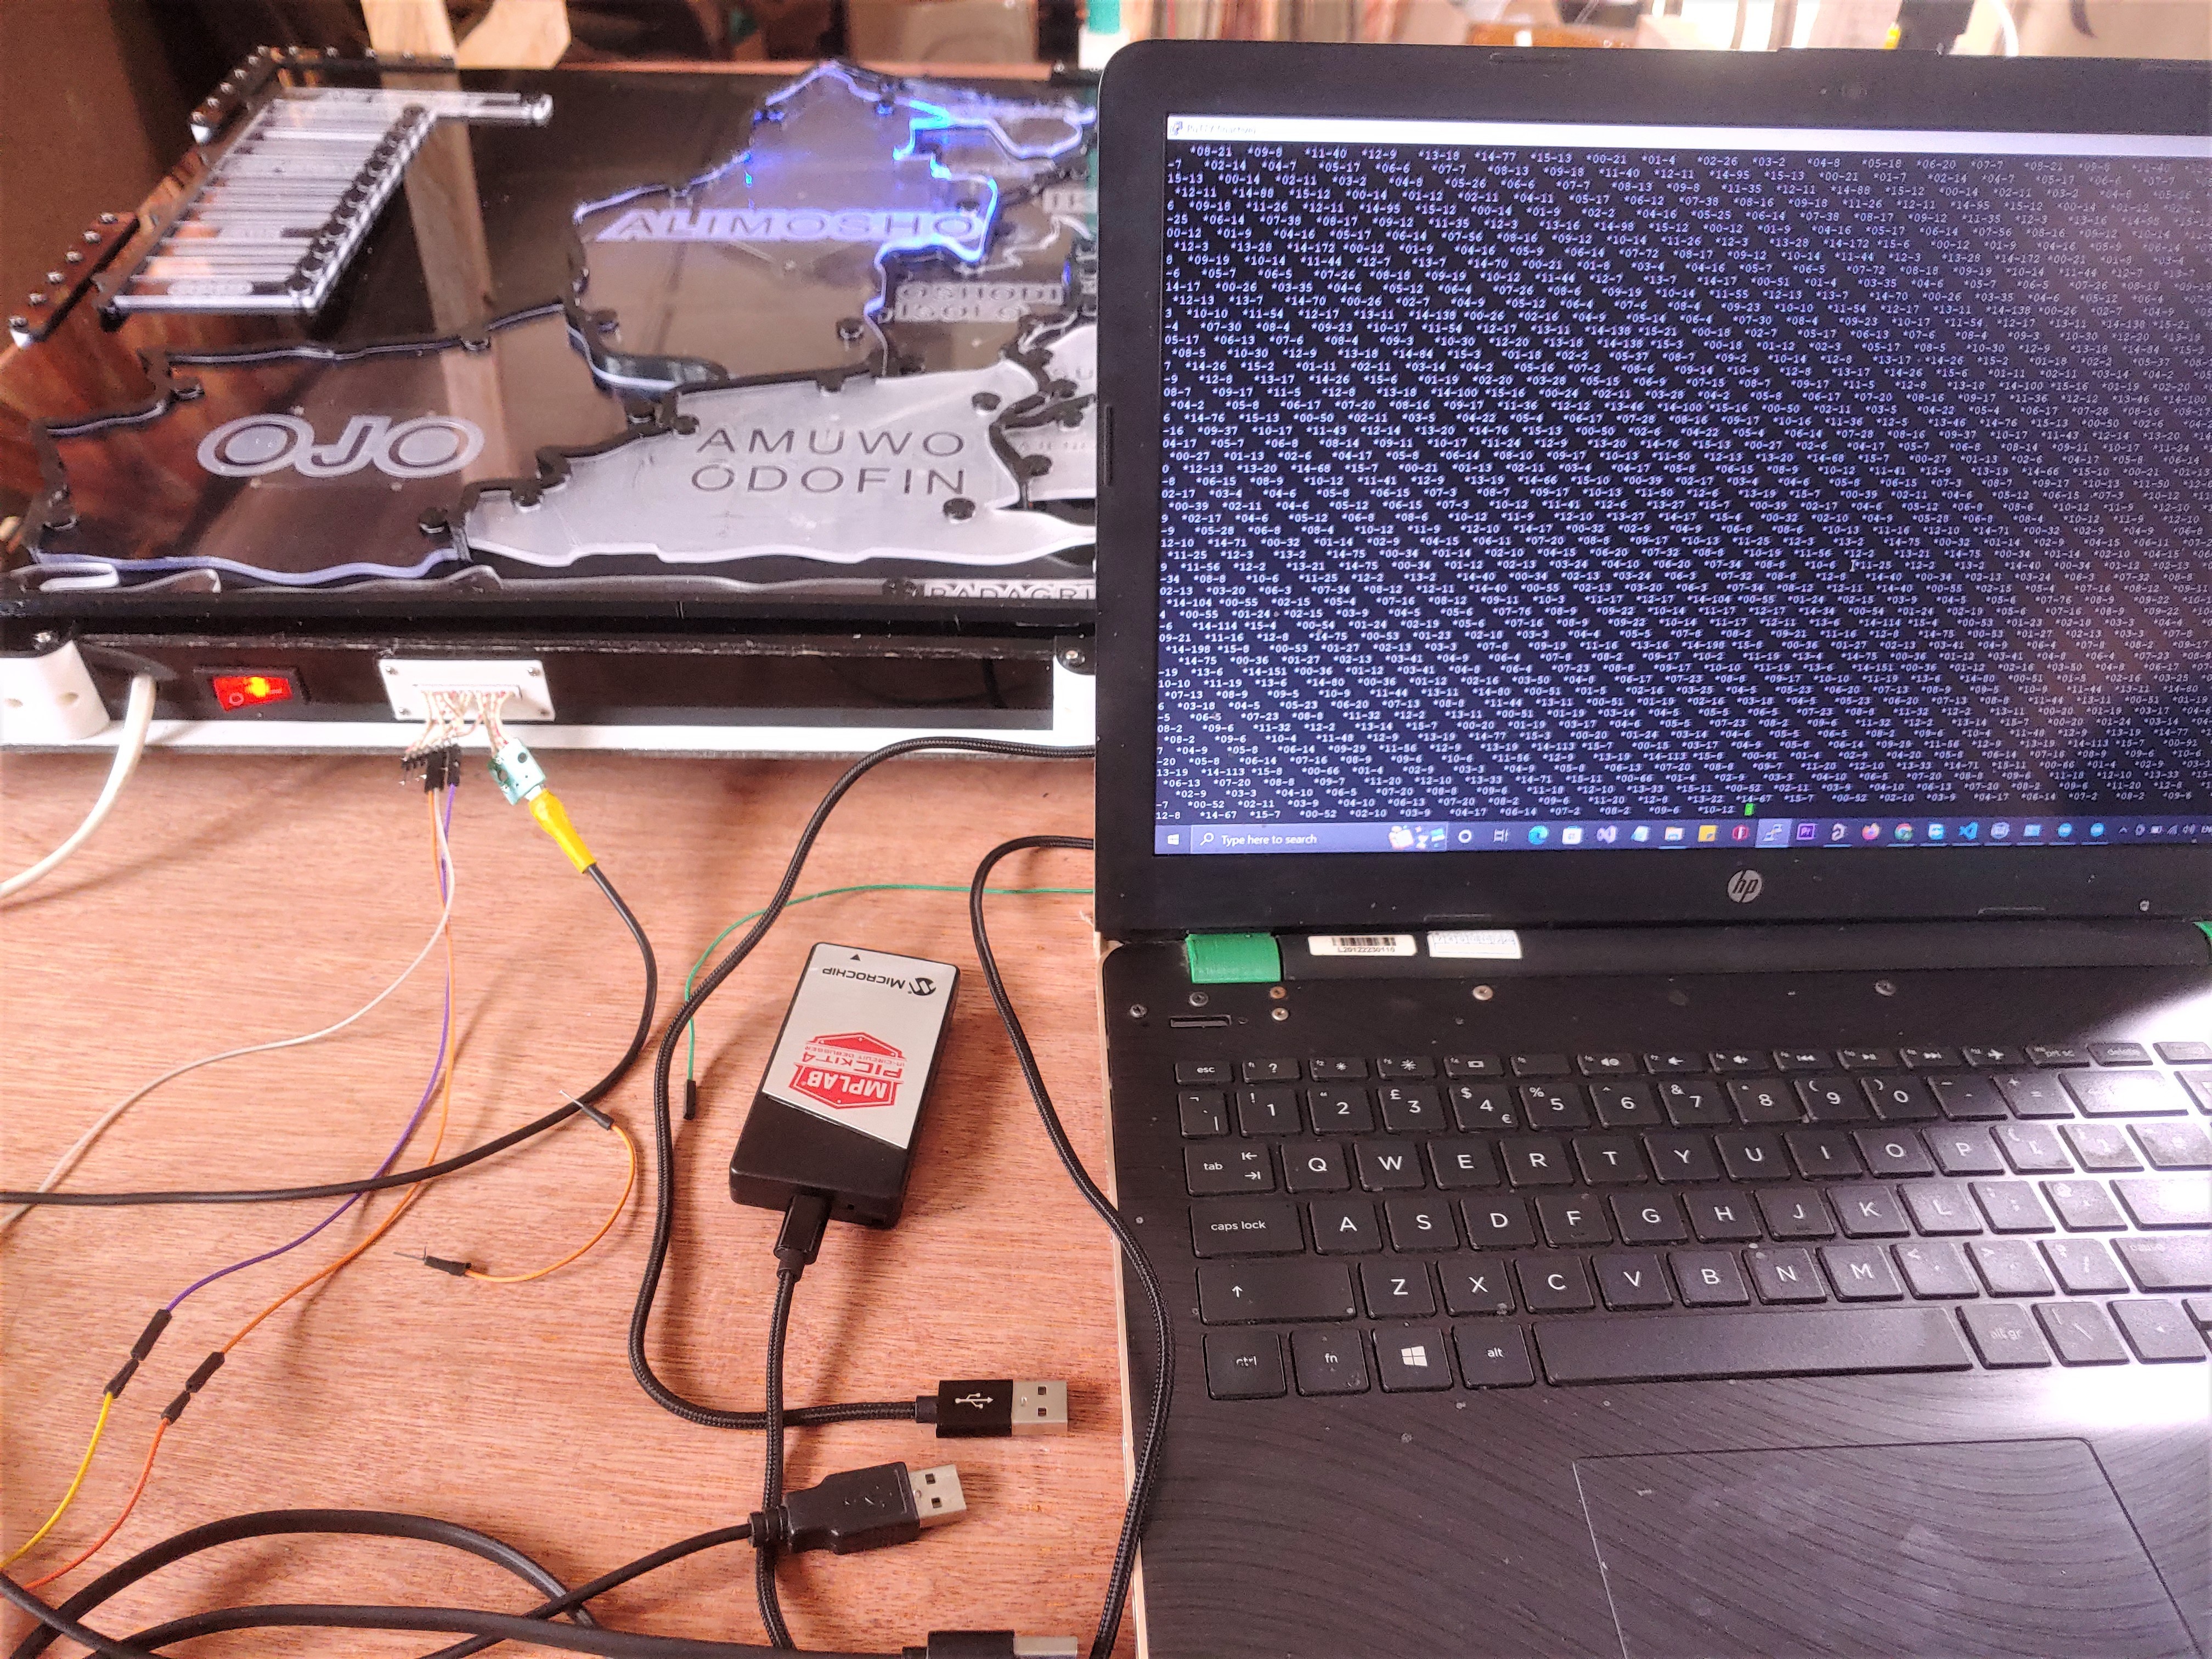
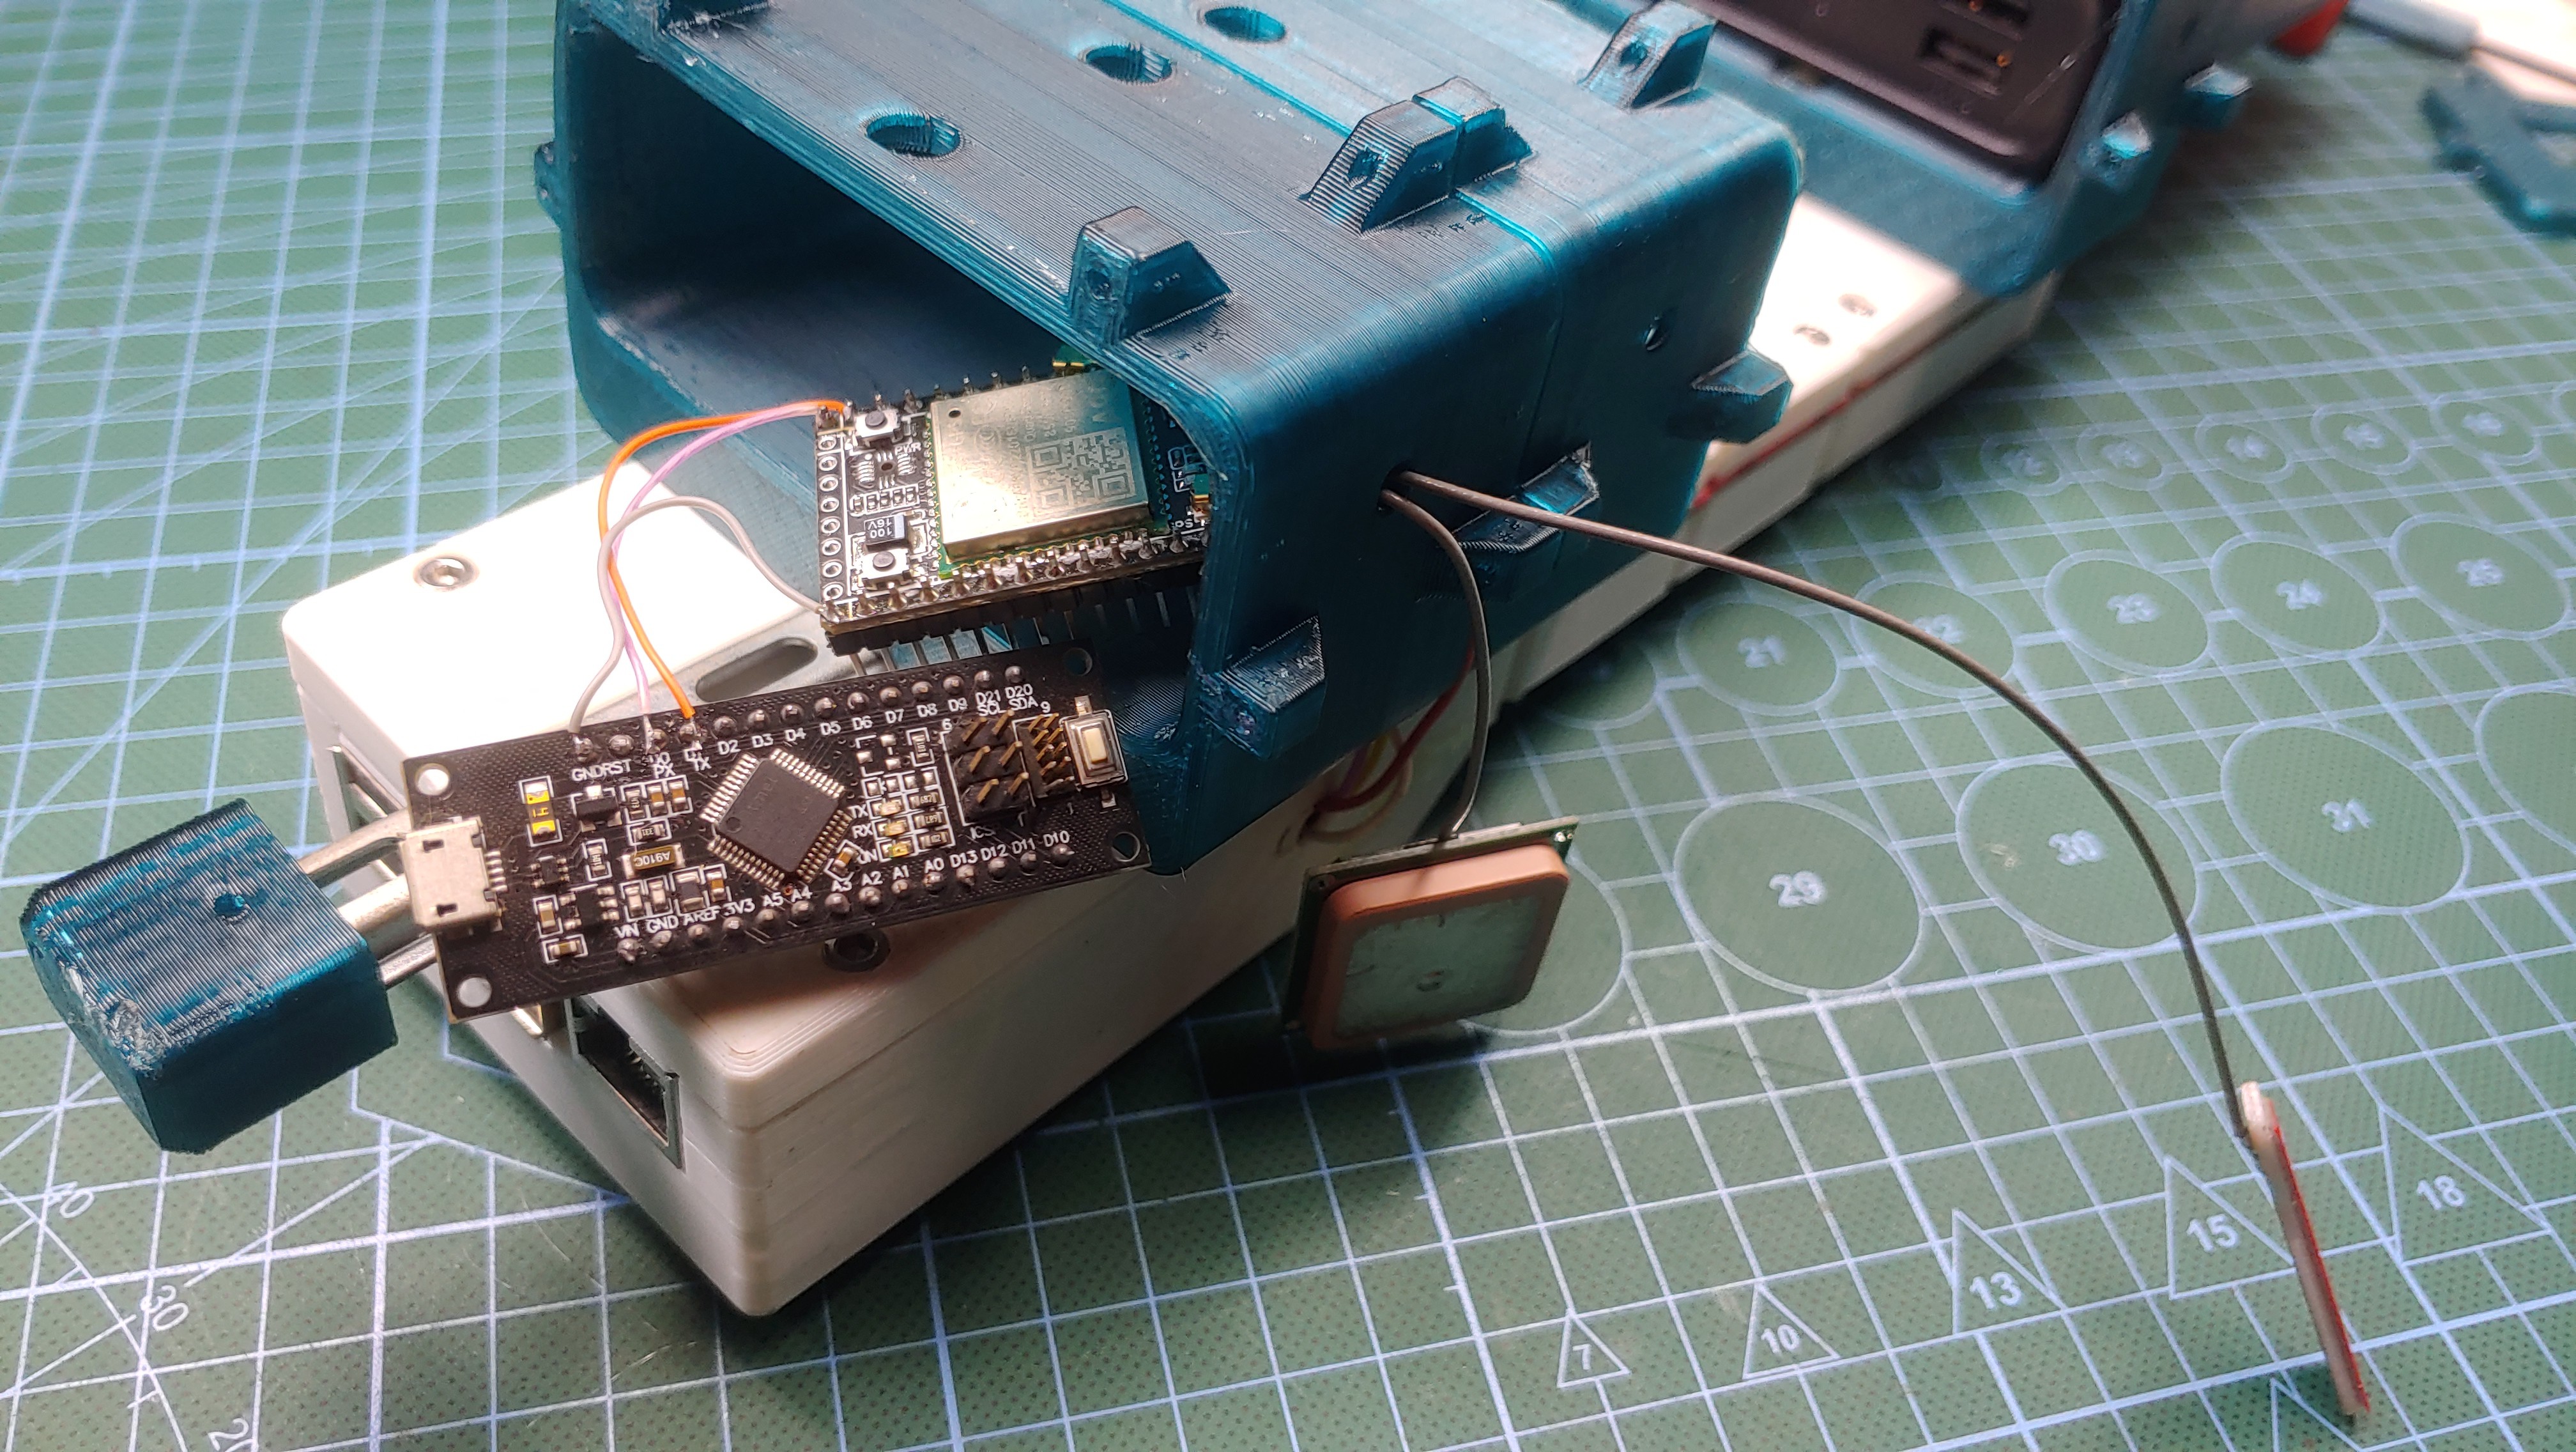
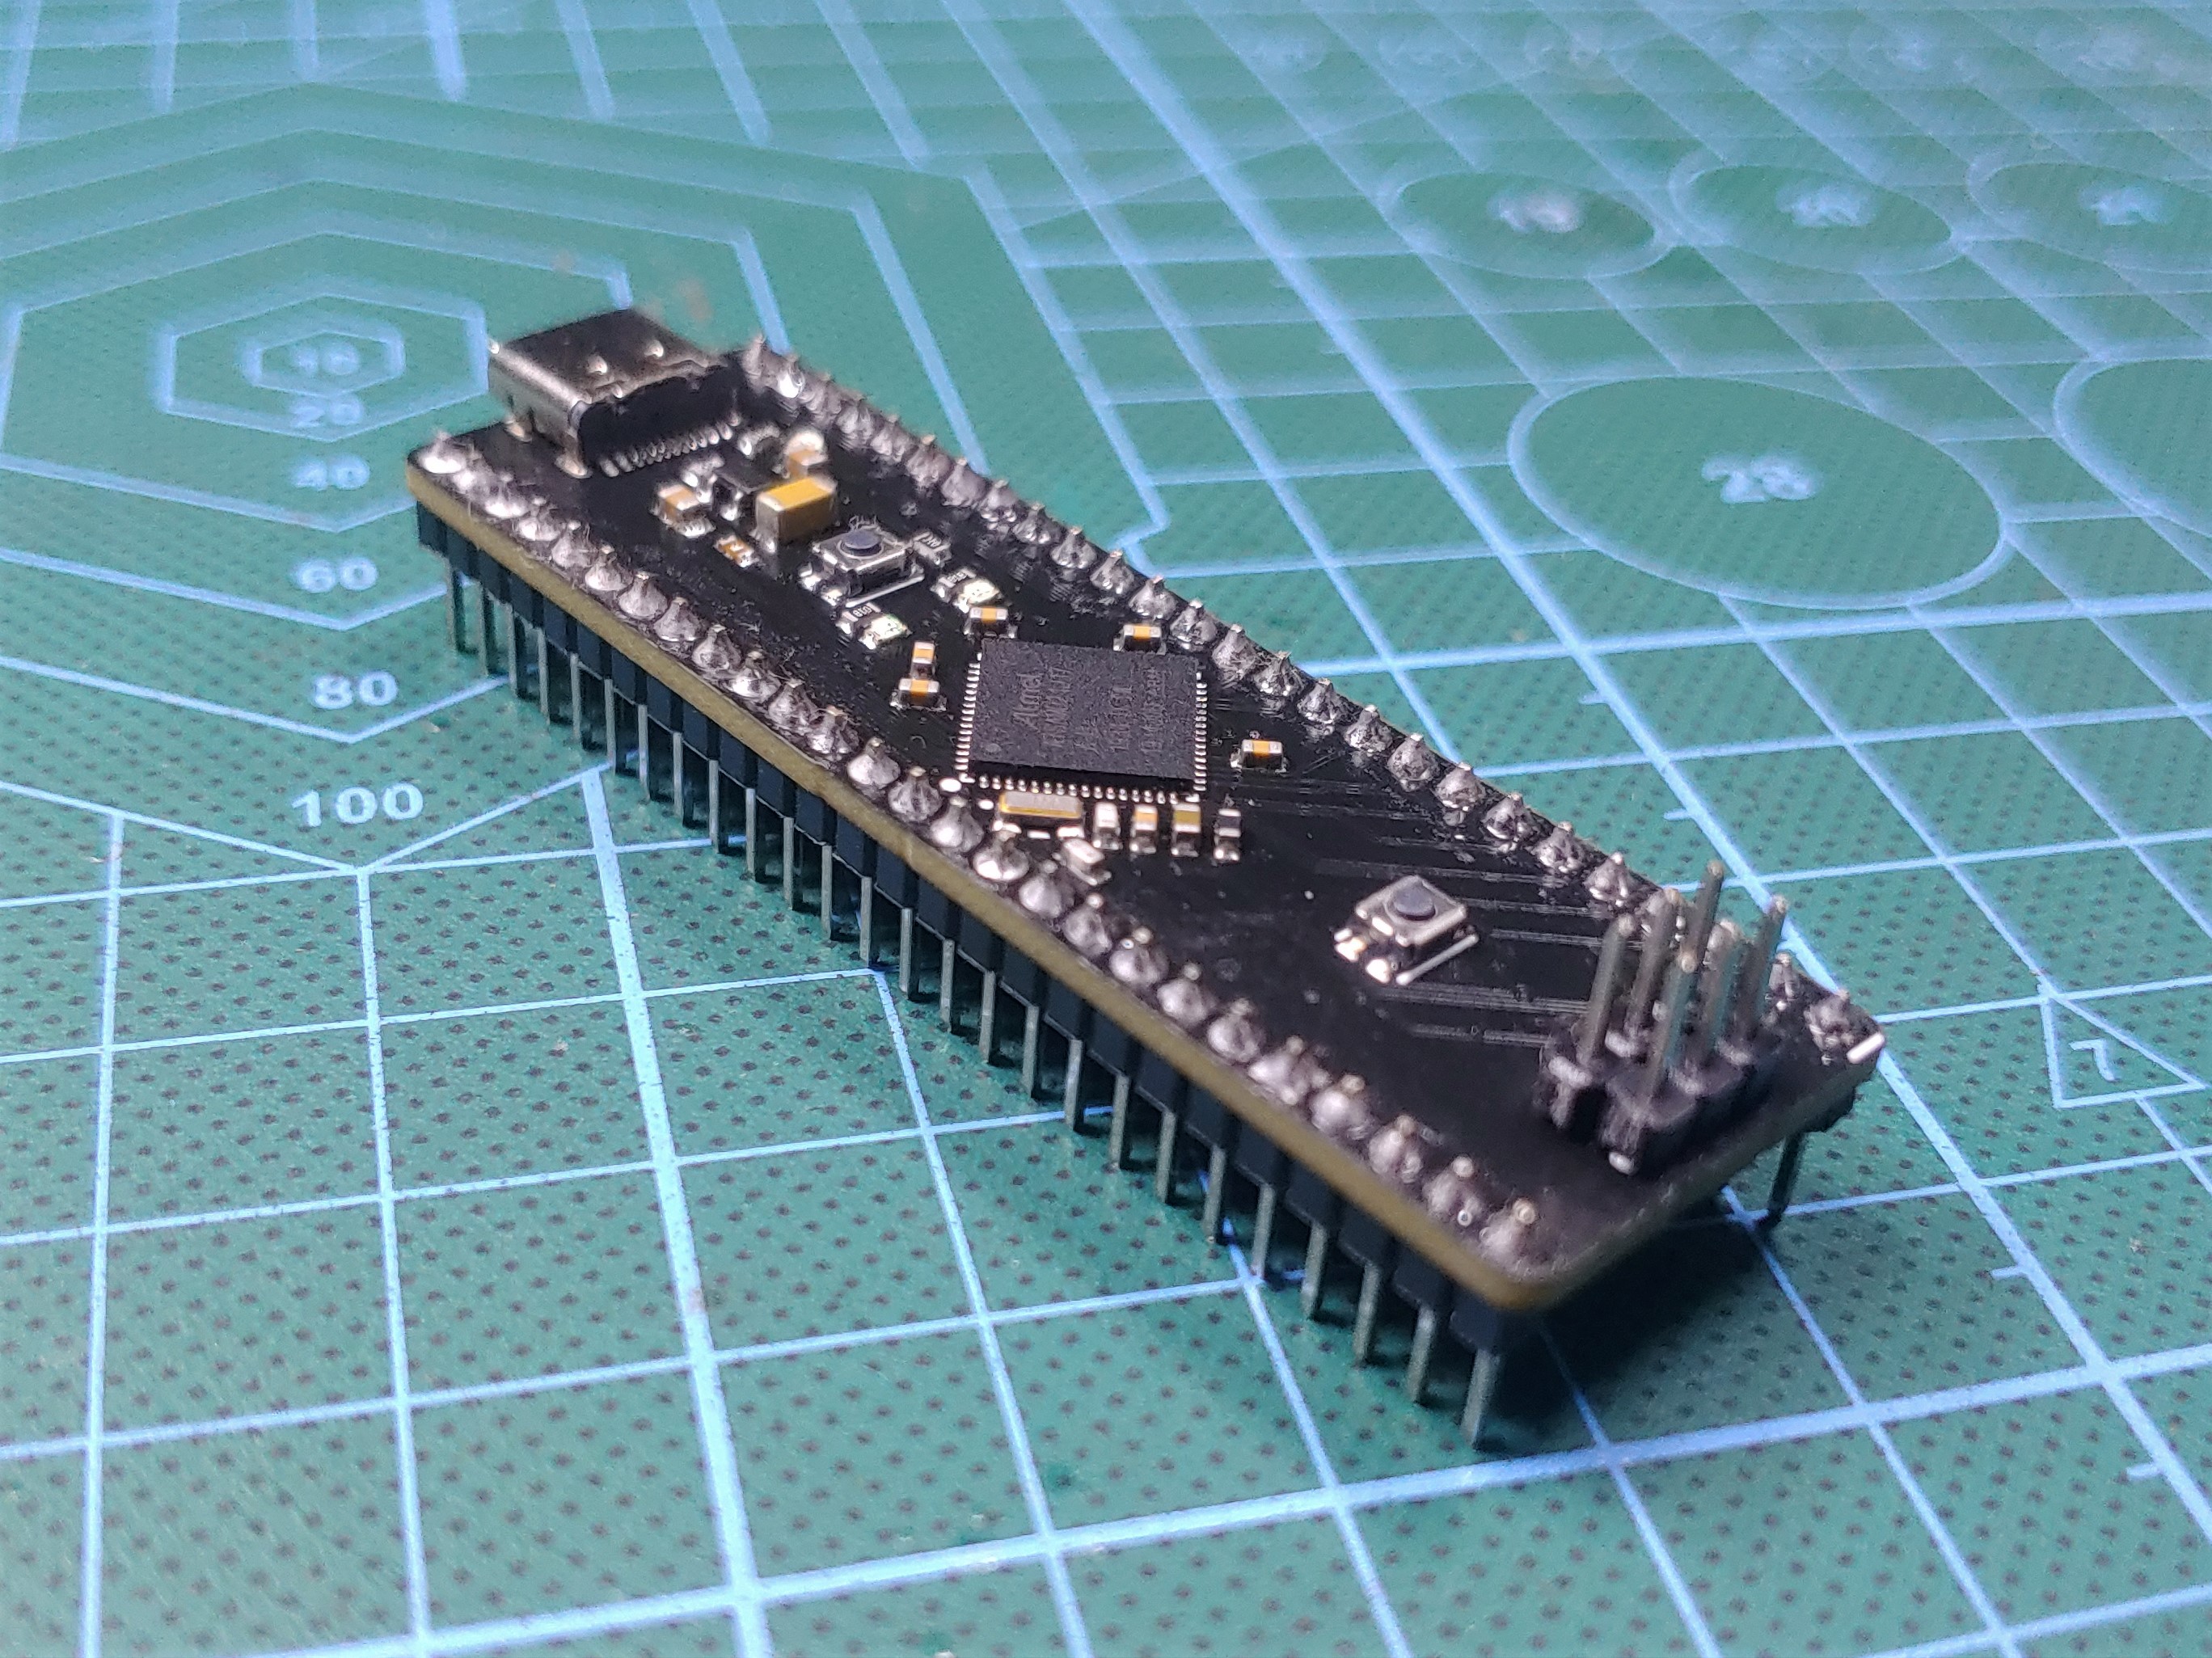
The map is controlled with two development boards, one is the Arduino WIFI 1010 which handles the IoT functions of the map and also controls the lighting on the map, and the second is a test board I designed based on the ATSAMD21J17 chip, its in charge of handling the capacitive proximity sensing on the map.
Capacitive Proximity controller - https://github.com/ahmsville/ATSAMD21J17-DEV-BOARD
Map CAD & Code - https://github.com/ahmsville/interactive-air-quality-map
The interactive air quality map was made possible thanks to DesignSpark who sponsored and provided the Environmental Sensor Development Kit (ESDK), you can catch up on the earlier stages of the project starting here.
The map gets its air quality data from a customized GPS-enabled air quality data logger (ESDK), and it can also be configured to pull data from the cloud and any available APIs.
")

Touch Demo


 Mauro Riva
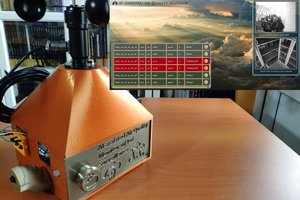
 kutluhan_aktar
 DARK-labs
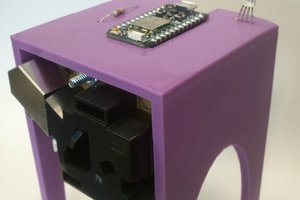
 Brock Hammill